Imagen
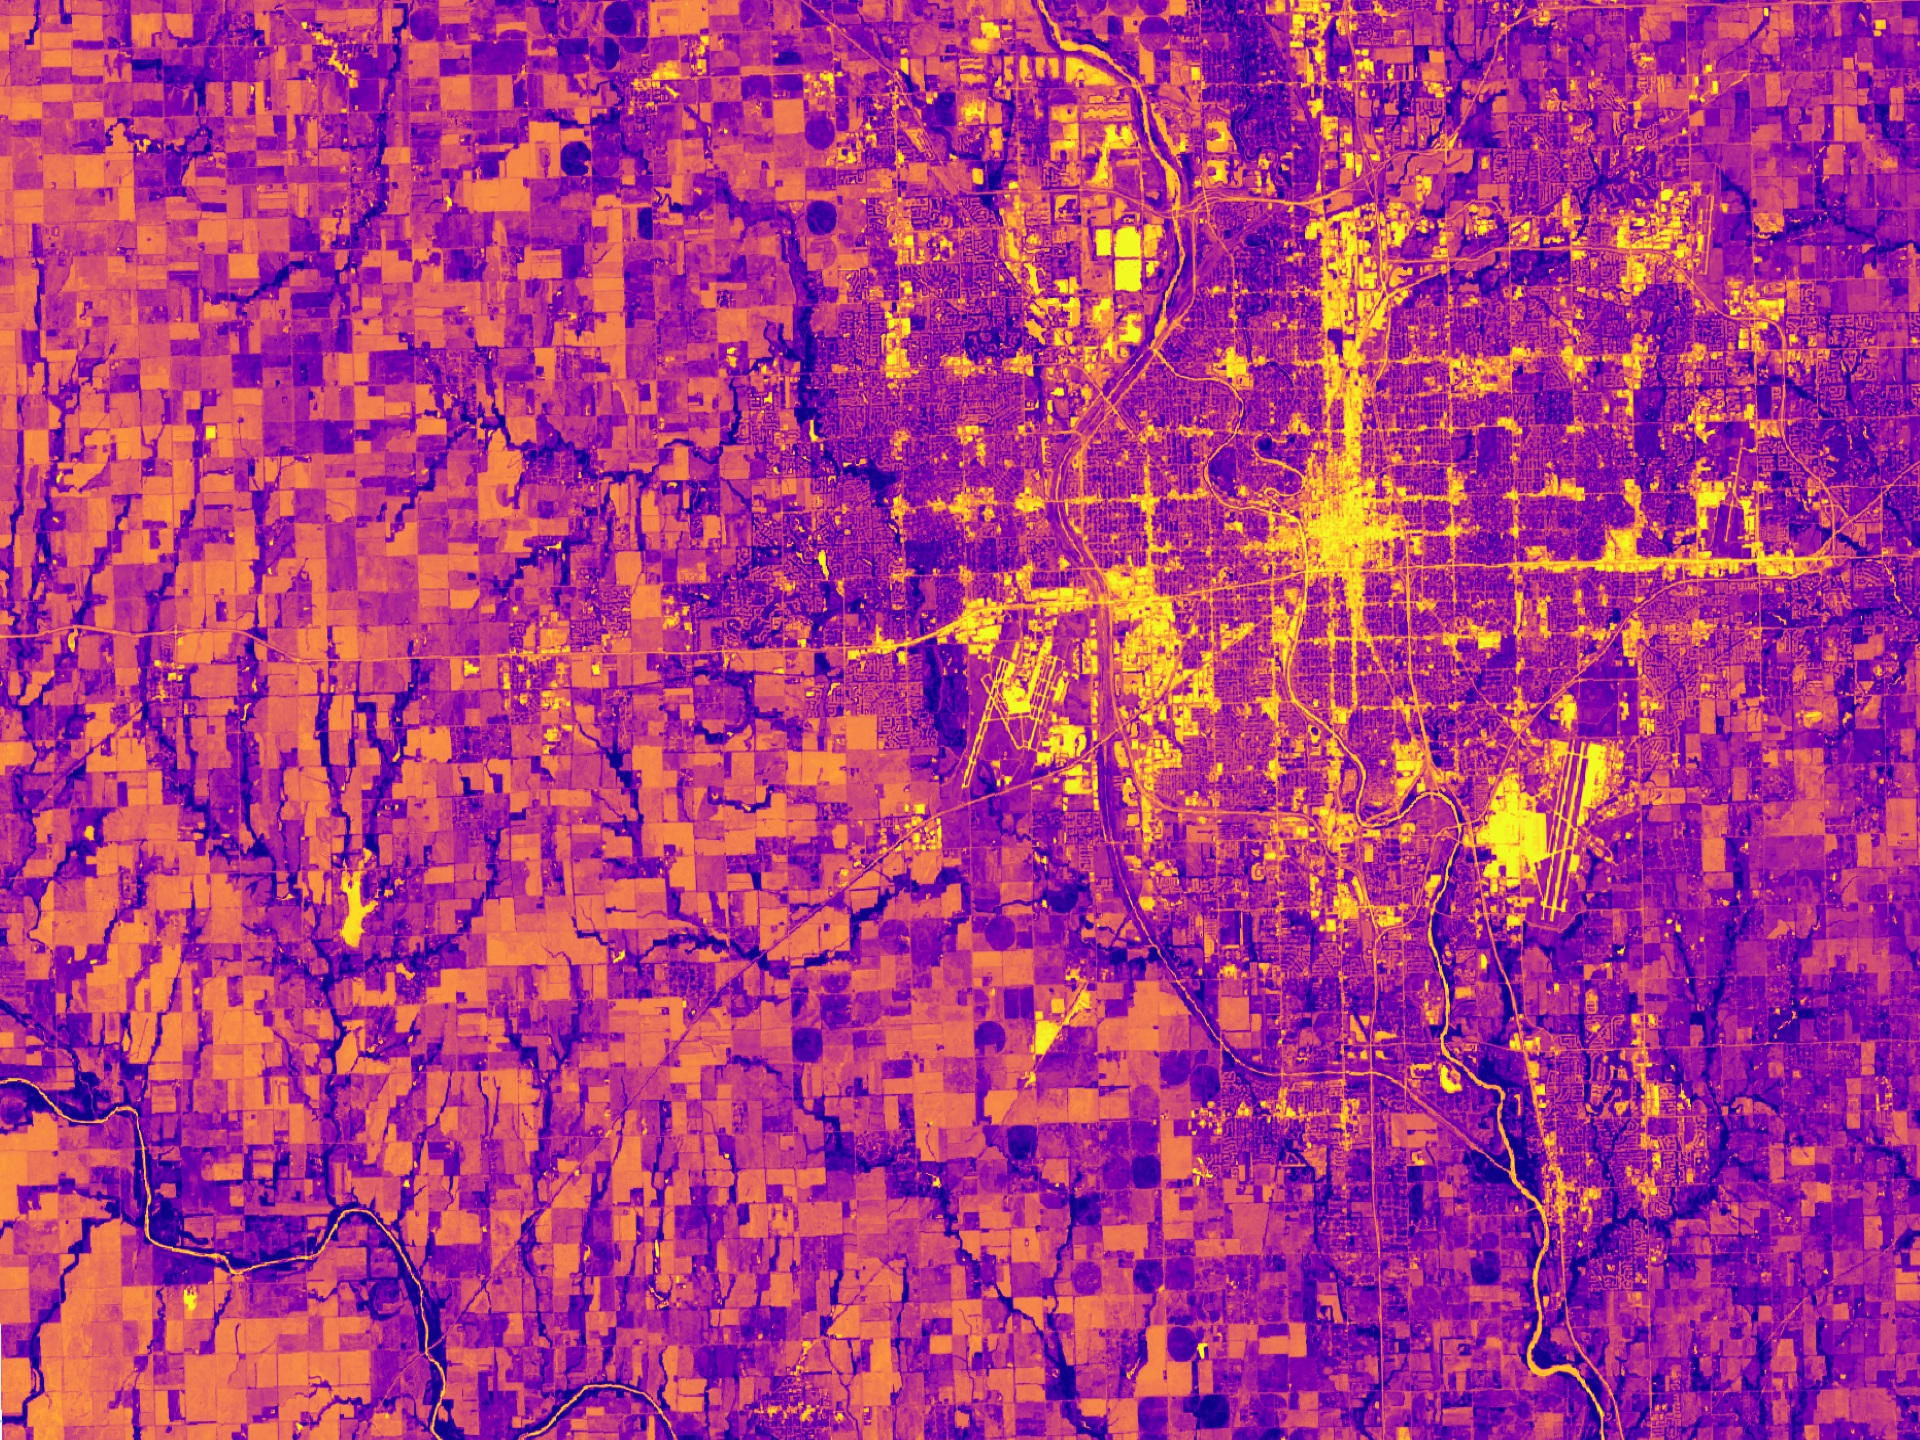
NDVI-processed imagery from Landsat 8 OLI data. This composite image of Wichita, KS, was created using 2018–2022 summer imagery. Lighter shades of yellow indicate limited vegetation in built-up areas and bodies of water, while darker shades of purple indicate dense vegetation. Understanding the spatial distribution of vegetation, such as tree canopy, is essential to recognizing and mitigating heat risk and prioritizing intervention.