UPDATE 9/18/18:
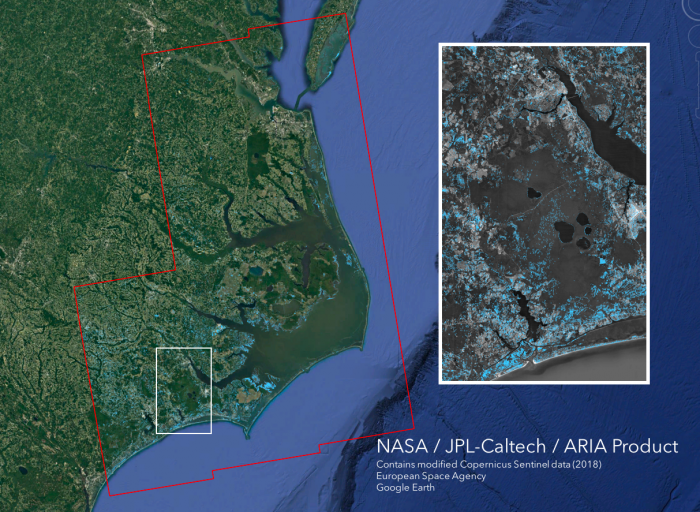
The ARIA team has created a flood extent map from Sentinel-1 SAR data acquired from Track 106, 36 hours after the landfall of Hurricane Florence. The map was pushed to the FEMA's SFTP server and is available to download from https://aria-share.jpl.nasa.gov/events/201809-Hurricane_Florence/FPM/
The Advanced Rapid Imaging and Analysis (ARIA) team at NASA's Jet Propulsion Laboratory in Pasadena, California, created this Flood Proxy Map depicting areas of Carolinas that are likely flooded as a result of Hurricane Florence, shown by light blue pixels. The map is derived from synthetic aperture radar (SAR) images from the Copernicus Sentinel-1 satellites, operated by the European Space Agency (ESA). The images were taken before (September 09, 2018) and 36 hours after the hurricane's landfall (September 15, 2018 18:57 PM local time).
The map covers an area of 53 miles x 152 miles (85 km x 245 km), indicated with the big red polygon. Each pixel measures about 33 yards x 33 yards (30 m x 30 m). Media reports provided anecdotal preliminary validation. This flood proxy map should be used as guidance to identify areas that are likely flooded, and may be less reliable over urban and vegetated areas. Sentinel-1 data were accessed through the Copernicus Open Access Hub. The image contains modified Copernicus Sentinel data (2018), processed by ESA and analyzed by the NASA-JPL/Caltech ARIA team. This research was carried out at JPL funded by NASA Disasters Program.
For more information about ARIA, visit: http://aria.jpl.nasa.gov
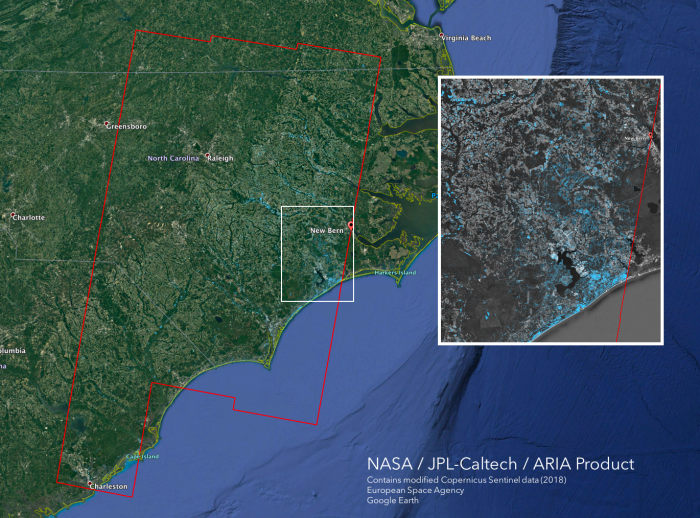
UPDATE 9/17/18:
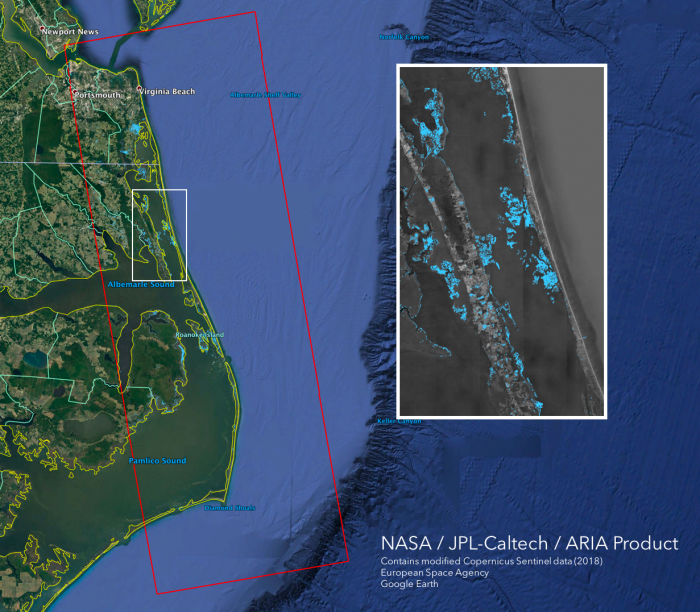
The ARIA team has created a flood extent map from Sentinel-1 SAR data acquired from Track 4, 12 hours after the landfall of Hurricane Florence. The map was pushed to the FEMA's SFTP server and is available to download from https://aria-share.jpl.nasa.gov/events/201809-Hurricane_Florence/FPM/
The Advanced Rapid Imaging and Analysis (ARIA) team at NASA's Jet Propulsion Laboratory in Pasadena, California, created this Flood Proxy Map depicting areas of Carolinas that are likely flooded as a result of Hurricane Florence, shown by light blue pixels. The map is derived from synthetic aperture radar (SAR) images from the Copernicus Sentinel-1 satellites, operated by the European Space Agency (ESA). The images were taken before (September 02, 2016) and 12 hours after (September 14, 2018 7:06 PM local time) the landfall of Hurricane Florence. The map covers an area of 155 miles x 310 miles (250 km x 500 km), shown by the large red polygon. Each pixel measures about 33 yards x 33 yards (30 m x 30 m).
Media reports provided anecdotal preliminary validation. Also, this map was cross-validated with ARIA's earlier flood proxy map derived from Sentinel-1 SAR data (Track 84) acquired at the time of the hurricane's landfall. This flood proxy map should be used as guidance to identify areas that are likely flooded, and may be less reliable over urban and vegetated areas. Sentinel-1 data were accessed through the Copernicus Open Access Hub. The image contains modified Copernicus Sentinel data (2018), processed by ESA and analyzed by the NASA-JPL/Caltech ARIA team. This research was carried out at JPL funded by NASA.
UPDATE 9/14/18:
The Advanced Rapid Imaging and Analysis (ARIA) team at NASA's Jet Propulsion Laboratory in Pasadena, California, created this Flood Proxy Map depicting areas of Carolinas that are likely flooded as a result of Hurricane Florence, shown by light blue pixels. The map is derived from synthetic aperture radar (SAR) images from the Copernicus Sentinel-1 satellites, operated by the European Space Agency (ESA). The images were taken before (October 12, 2016) and at the time (September 14, 2018 7:15 AM local time) when Hurricane Florence made landfall near Wilmington, NC. The map covers an area of 155 miles x 233 miles (250 km x 375 km). Each pixel measures about 33 yards x 33 yards (30 m x 30 m). Media reports provided anecdotal preliminary validation. This flood proxy map should be used as guidance to identify areas that are likely flooded, and may be less reliable over urban and vegetated areas. Sentinel-1 data were accessed through the Copernicus Open Access Hub. The image contains modified Copernicus Sentinel data (2018), processed by ESA and analyzed by the NASA-JPL/Caltech ARIA team. This research was carried out at JPL funded by NASA Disasters Program.
For more information about ARIA, visit: http://aria.jpl.nasa.gov