Tornadoes, tsunamis, and hurricanes are considered perils worthy of their own disaster movies. Hollywood producers might be missing a more likely threat within the genre: hailstorms. In the real world, hailstorms are much more likely to form than tornadoes, resulting in $10’s of billions in damage each year worldwide. In the U.S. alone, NOAA estimates that 152 billion-dollar weather disasters from 1980 to 2021 resulted from severe storms, and the majority of these disasters included significant hail damage.
The NASA Applied Sciences A.37 ROSES research project, “Hailstorm Risk Assessment Using Space-Borne Remote Sensing Observations and Reanalysis Data,” focuses on developing satellite-based tools to better understand and track where hail has most often occurred, and to identify areas damaged by hail. Kris Bedka serves as principal investigator on the project, leading the “Satellite Mapping and Analysis of Severe Hailstorms” team. For those who love deciphering NASA acronyms, that one is apt. They are the SMASH team.
Reinsurance Industry and CatModel Development
The project is a partnership between NASA’s Langley Research Center and NASA’s Marshall Space Flight Center, Willis Towers Watson (WTW) reinsurance, international partners in South America and Germany, and several academic partners throughout the United States.
Reinsurance is insurance for insurance companies. Insurers carry cash to make payouts, but if a disaster causes billions of dollars in damage, insurance companies don’t always have enough money on hand to pay everyone all at once. Reinsurance companies use catastrophe models (CatModels) to assess risk to insurers.
WTW, now Gallagher Re, asked Bedka’s team to develop a long-term climatology of hailstorm pattern detections using data from a variety of satellites, including Meteosat Second Generation (MSG), Tropical Rainfall Measuring Mission (TRMM), and Global Precipitation Measurement Mission (GPM) over South Africa.
“We delivered a 14-year database of observations from different satellites to them, and in March 2021, they released an operational hailstorm CatModel,” explains Bedka.
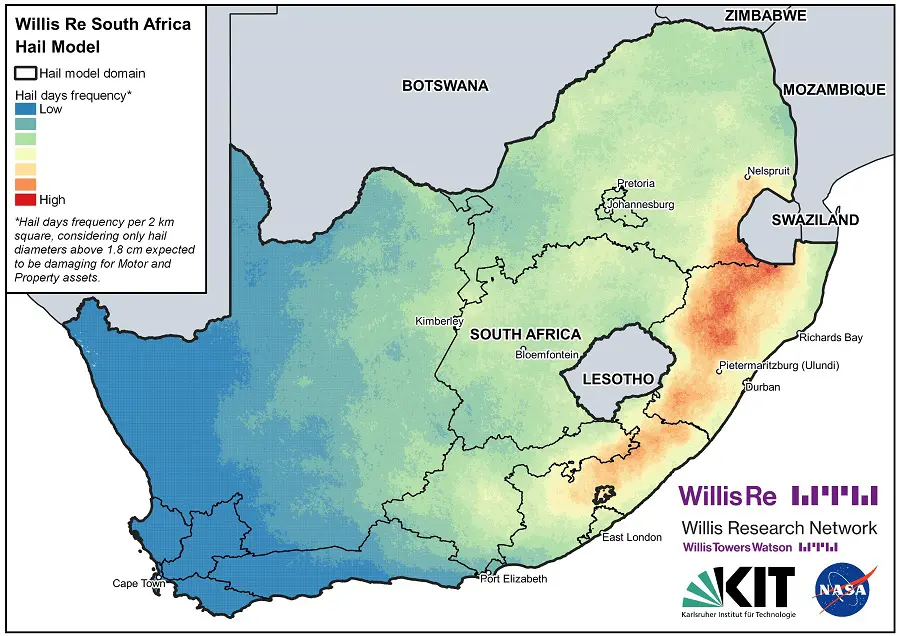
South Africa is a growing insurance market where hail damage is relatively frequent. Without a long-term and seamless weather radar network, it is difficult to determine the climatology of hailstorm frequency and severity. Bedka explains that “ground-based radars scan about every five minutes and create a picture of storm structure and where hail is probably occurring.” The United States is fortunate to generally know where hail has most often occurred due to its comprehensive radar network and human severe-storm spotters, but the same can’t be said for all regions worldwide.
Before the project started, the team developed hail CatModels over Europe and Australia, resulting in an Application Readiness Level (ARL) 7 – which means the prototype functionality was demonstrated and used for decision-making. The team continued to improve their modeling and storm detection techniques with the South Africa dataset, and by the end of last year, WTW’s clients were using the South Africa CatModel, increasing the ARL to 8. The team is looking forward to demonstrating an ARL 9 with sustained industry usage for decision-making.
Bedka shares that South America is the next frontier for CatModel development. “Regions of South America, including Argentina, Paraguay, Uruguay, Brazil, and Colombia, are frequently impacted by hailstorms, with severity comparable to or sometimes exceeding those over the U.S. Great Plains. We seek to combine historical Geostationary Operational Environmental Satellite (GOES) data with information from reanalysis such as how unstable the atmosphere was and atmospheric wind shear to estimate hailstorm frequency,” Bedka says.
Processing the entire globe at once would be very impractical. Bedka and his team can acquire images about every 15 minutes from geostationary satellites. With over 20 years of observation data, the team must prioritize. The project processes data in regions and will be pursuing a 20+ year data record over South America.
Satellites and Data Consistency
NASA recently released a database of hailstorm detections from TRMM and GPM microwave imager data extending from January 1998 through March 2021. “We developed a consistent and long-term database that clearly shows where hailstorms have most frequently occurred and released it for anyone in the research community, the public, or industry to visualize and use. That is a pretty exciting milestone for us,” says Bedka.
Data consistency over a long time is essential to climatological research. SMASH researchers have developed pattern recognition algorithms to identify possible hailstorms. As technology advances, images from satellites become crisper and sharper, which can lead to discrepancies in algorithm performance.
“If you go from blurry images to much sharper images, your algorithms are naturally going to perform better on the really good imagery,” Bedka notes.
Geostationary Operational Environmental Satellite (GOES) 8 through 15 have consistent technology to maintain coherent decades-long data records. The newest generation of GOES satellites, GOES-16 through –18, provides images four times crisper than their predecessors, which adds a slight challenge for climatological research.
Additional Applications
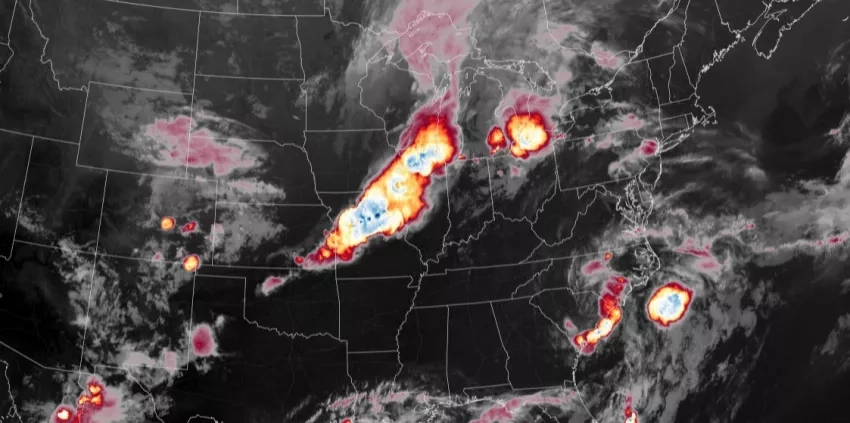
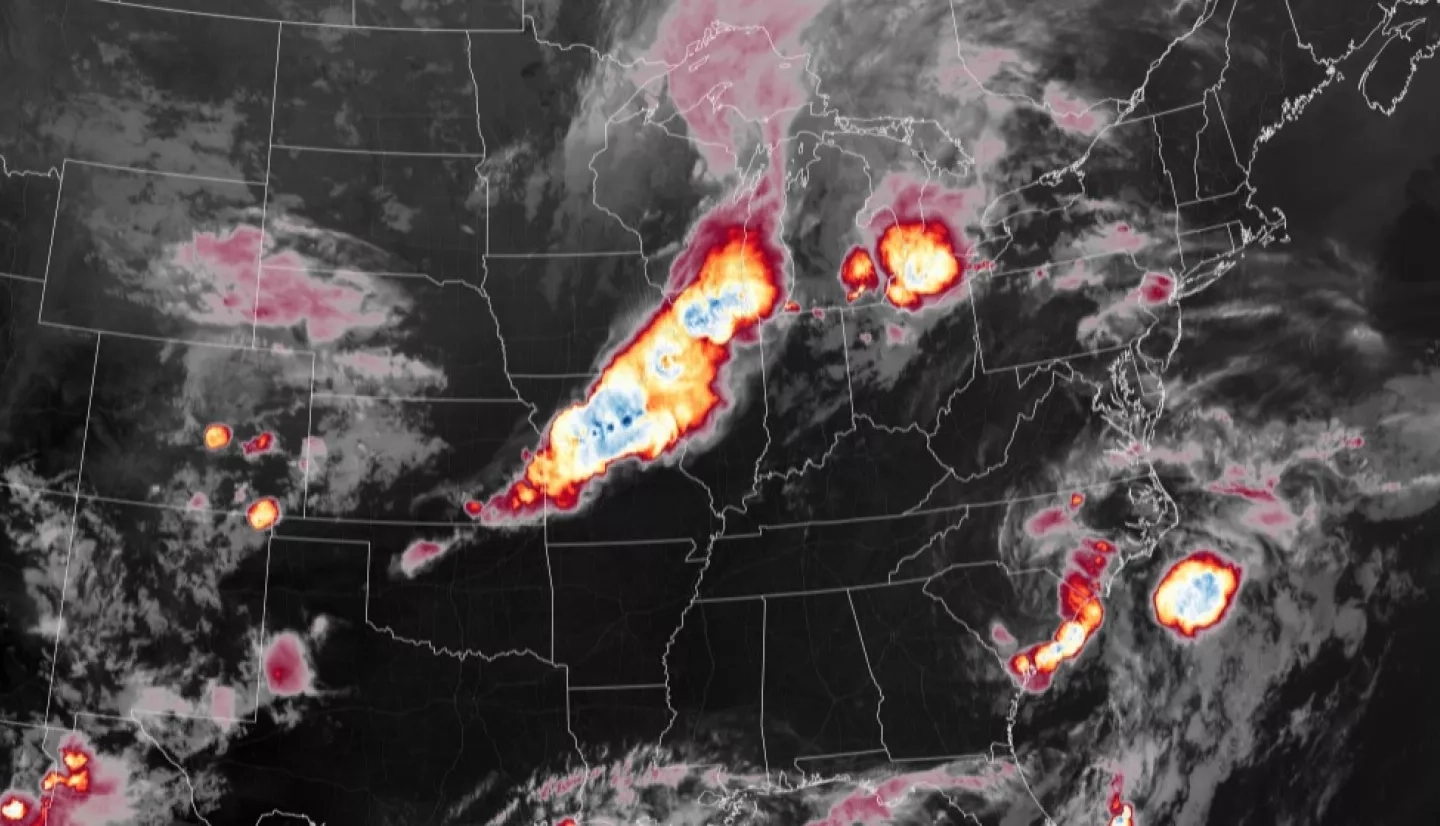
In August 2020, a massive windstorm, called a derecho, brought winds of up to 140 mph through Iowa and Illinois. Media reports said it was the costliest severe storm event in the United States history, wreaking over $11 billion in damage. With the help of satellite and radar data, the SMASH team was able to map out individual storm cells that caused the damage. Scientists can also leverage the vantage point of space to understand where wind and hail damage caused the browning of crops. A sensor, called synthetic aperture radar (SAR), can illustrate the change in crop orientation after storms strike.
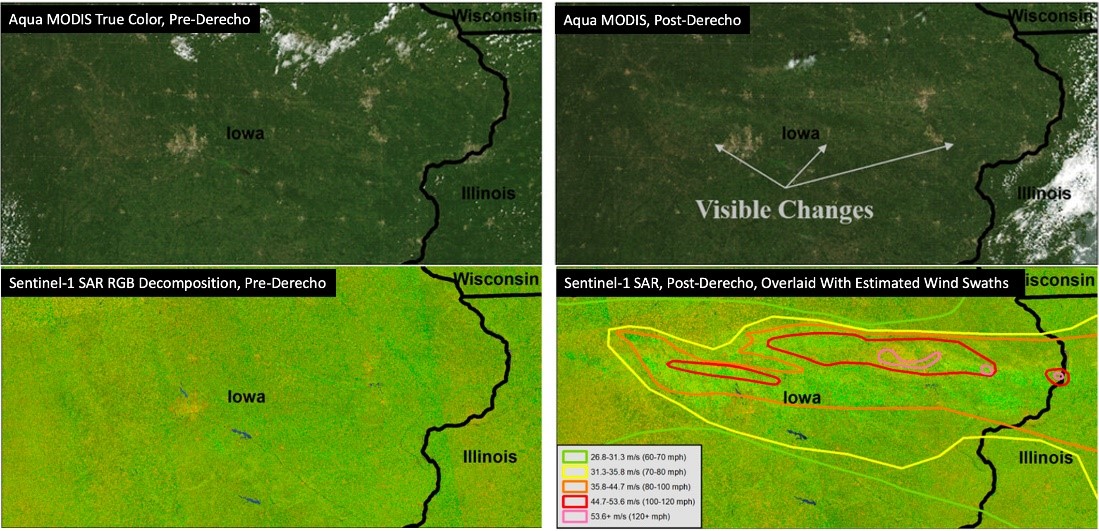
Bedka explains, “Our team members at NASA Marshall were able to precisely quantify the damage patterns using this synthetic aperture radar data because crops were blown over but did not turn brown very much. Then we compared that to agricultural industry estimates of the damage and found close agreement.”
This event allowed the team to demonstrate how SAR data can streamline the detection and mapping of damage swaths from severe storms. Now that the SMASH team has shown what’s possible, they can continue to develop those capabilities in the future. To scientists, the reinsurance industry, and decision-makers, the real-world images and data that provide an enhanced understanding of severe storm and hail damage can be even more exciting than this year’s blockbuster motion picture.