Imagen
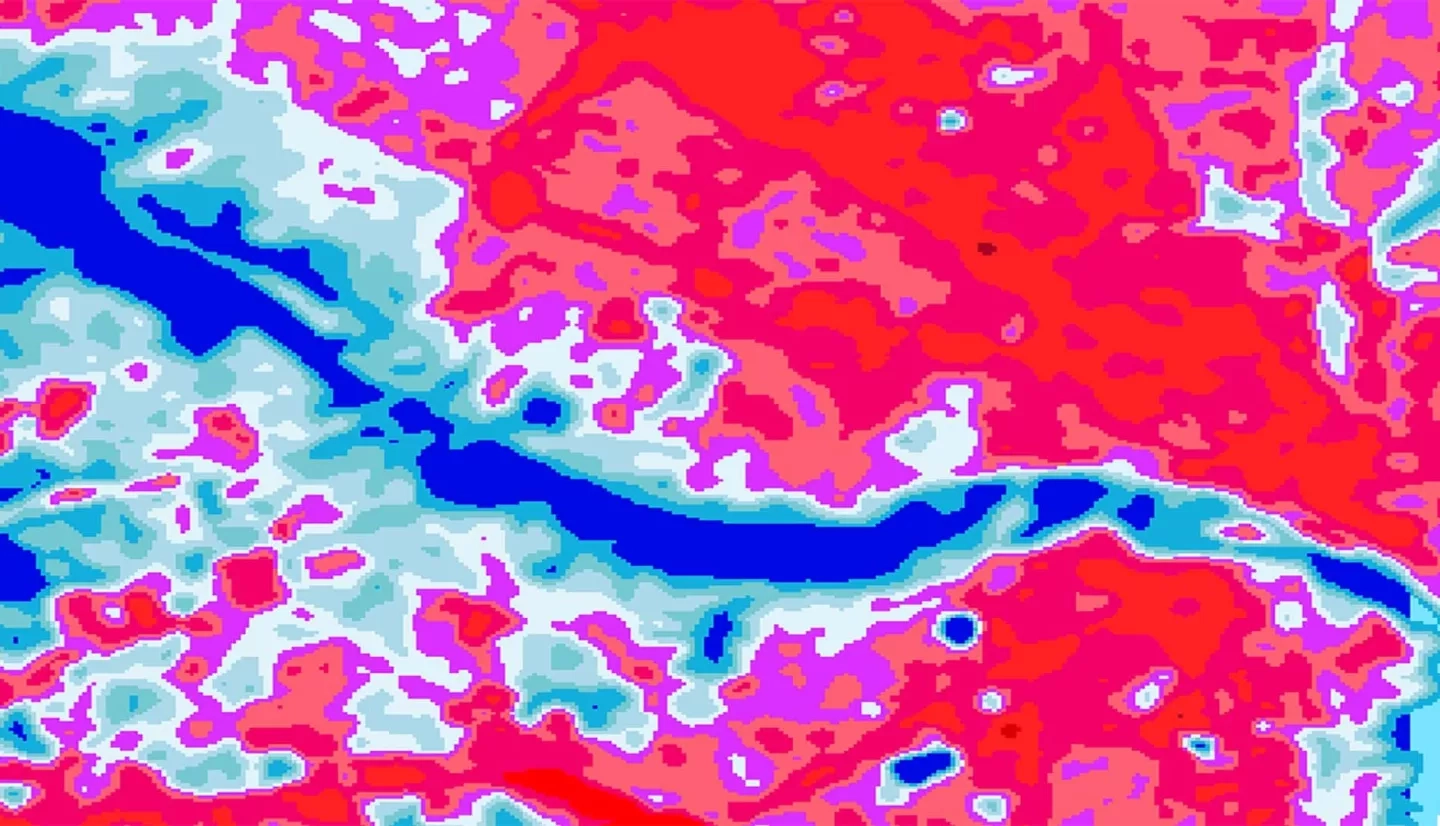
Cities around the world are adopting adaptation and mitigation strategies for extreme heat events, which are projected to increase in upcoming years. As Richmond, Virginia continues to grow, its residents are more likely to experience more extreme temperatures resulting from the urban heat island effect. An increase in impervious surfaces such as asphalt and concrete, which retain more heat energy than the natural environment, drive this effect. Efforts to alleviate these problems include supporting interventions by local non-profits, including Groundwork RVA, and working with the Richmond City Planning Office to prioritize increased tree cover in the area. In this project, we used Landsat 5 Thematic Mapper (TM), Landsat 8 Operational Land Imager (OLI) and Thermal Infrared Sensor (TIRS), and Terra Advanced Spaceborne Thermal Emission and Reflection (ASTER) data to analyze these patterns in land surface temperature. To inform these patterns, we also examined the significance of the city's infrastructure and land use choices. Land cover was assessed for selected years using data from the Virginia GIS Clearinghouse and the National Agriculture Imagery Program. Heat vulnerability indicators and land cover data were synthesized using US Census and health records and Centers for Disease Control (CDC) Social Vulnerability Indicators. These indicators depict the sensitivity of the population to extreme heat and identify where vulnerable demographics reside. Along with identifying these areas of concern, our results indicated that the urban heat profile of Richmond has dramatically increased and expanded in the last twenty years. Groundwork RVA can use temperature assessment maps along with these heat vulnerability indicators to establish, carry out and prioritize green infrastructure projects in the city.