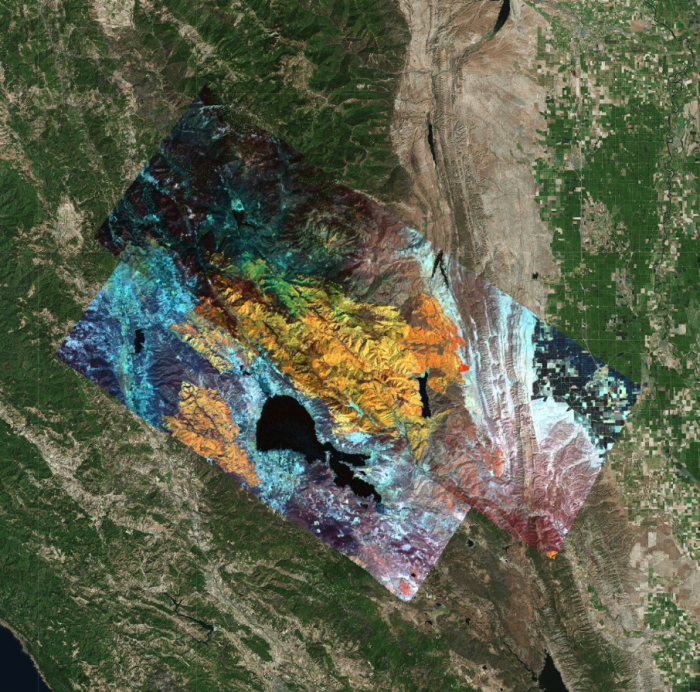
The ER-2 aircraft carrying the MASTER (the NASA MODIS/ASTER) sensor flew over Mendocino Complex Fires on August 9, 2018. The sensor captured images of both fires in the area with the Ranch Fire on the north side of Clear Lake and the River Fire on the south side. The products are false color RGB composites, which allow for the identification of various features within the fire, which can be obscured by the smoke produced by the fires.
The ER-2 aircraft carrying the MASTER (the NASA MODIS/ASTER) sensor flew over Donnell Fire on August 9, 2018. The sensor captured images of the fire in the Sierra Nevada Mountains within the Stanislaus National Forest. The products are false color RGB composites, which allow for the identification of various features within the fire, which can be obscured by the smoke produced by the fires.
The ER-2 aircraft carrying the MASTER (the NASA MODIS/ASTER) sensor flew over Ferguson Fire on August 9, 2018. The sensor captured images of the fire in the Sierra Nevada Mountains just to the west of Yosemite National Park. The products are false color RGB composites, which allow for the identification of various features within the fire, which can be obscured by the smoke produced by the fires.
Suggested Use:
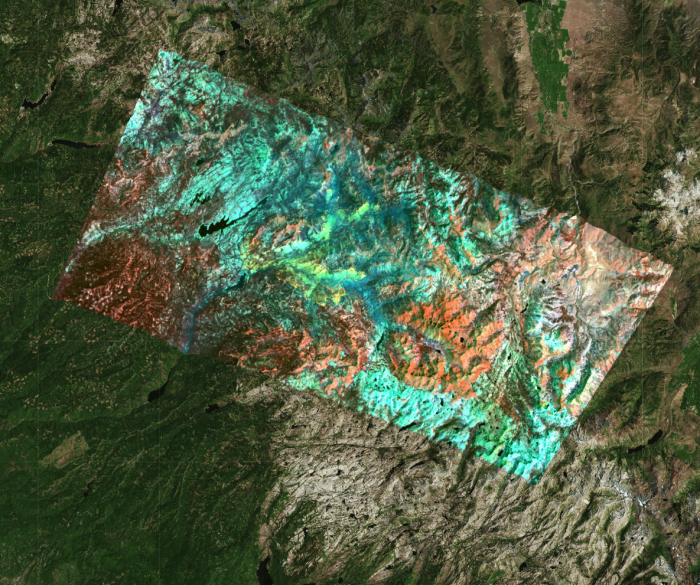
Fire Intensity RGB Composite: This band combination (11.3293 um, 2.2106 um, 1.6092 um) depicts various fire intensities. Areas with an active fire are seen in yellow hues, while the warm, burned areas are in shades of orange. Unburned vegetation is seen in magenta and blue/green tones. The fire burned area is readily apparent and small active fire (flames) are seen on the leading edges of the fire perimeter.
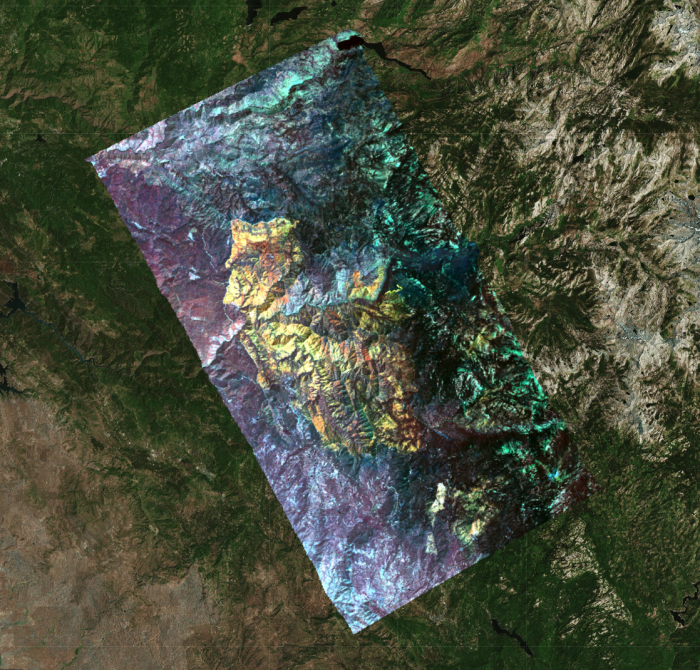
Burn Severity RGB Composite: This band combination (2.2106 up, 0.7499 um, 1.6092 um) is used to indicate various burn severity areas within the fire perimeter. Since this band combination uses a visible channel, it does also display the smoke plume (shown in vibrant green). The red/pink/magenta areas represent the various burn severity regions. Unburned vegetation is shown in green, grey and white with water in black or dark blue. This band combination is usually used on fires that are out, and when no smoke is evident any longer.
Sensor:
MASTER aboard the ER-2 aircraft; 50 meter resolution at ER-2 altitude of ~65,000 feet
MASTER is the NASA MODIS/ASTER (MASTER) airborne simulator. Info on the platform sensor can be found here: https://asapdata.arc.nasa.gov/sensors/master.html