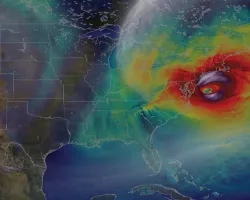
This GPM IMERG animation shows rainfall accumulations from #HurricaneBarry in the Gulf of Mexico from July 11-16, 2019. Learn more: https://t.co/1QjFLDbD0k pic.twitter.com/CC7J0AsSTW
— NASA Precipitation (@NASARain) July 17, 2019
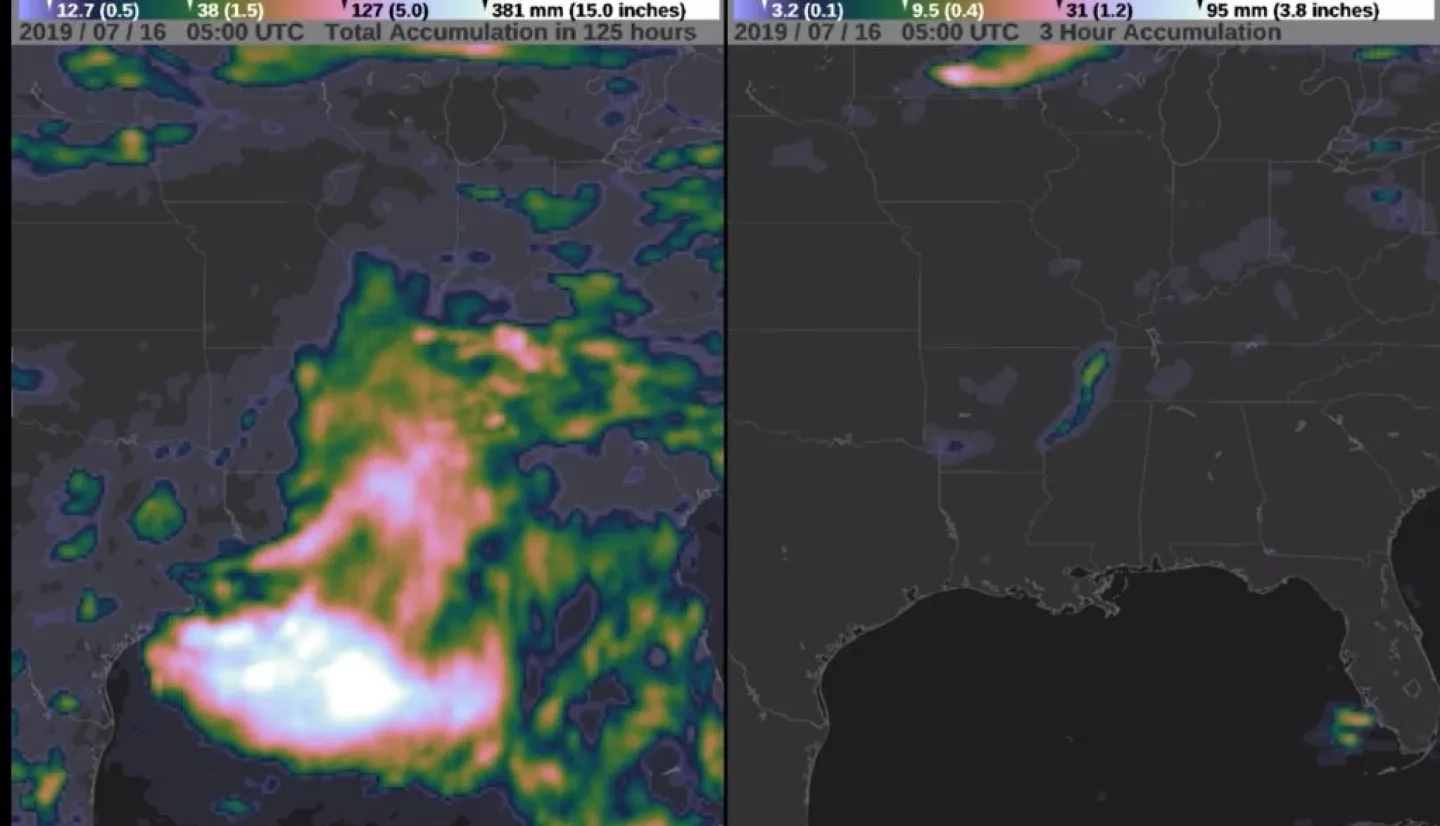
This animation shows the heavy precipitation that Hurricane Barry produced from July 11-16 in the Gulf of Mexico and the southcentral United States. While forecasters were initially concerned that the largest accumulations would extend far over land, the heaviest rainfall remained mostly offshore. Precipitation estimates are derived from the GPM IMERG product, which combines microwave and infrared observations from an international constellation of satellites united by the GPM Core Observatory. The left side of the movie shows the total accumulation starting in the early hours of July 11, while the right side shows the accumulation during the most recent 3-hour period observed.