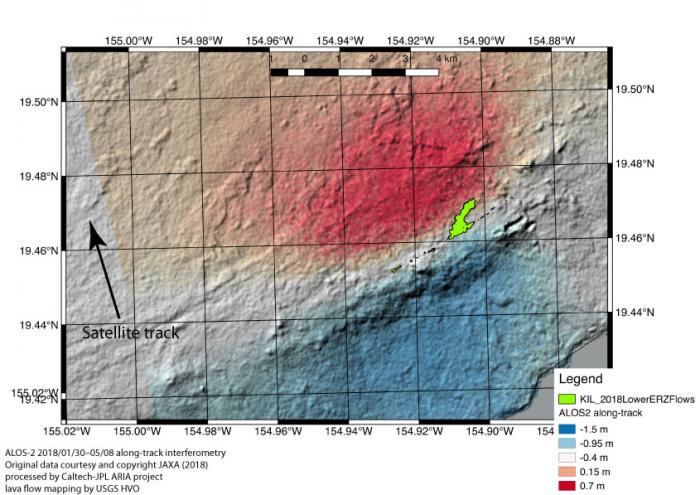
The above map shows ALOS-2 SAR scenes acquired in January 2018 and May 8, 2018 and shows the early opening of the lower East Rift Zone before May 8. In this first map there is a zone approximately 1.5 km wide where there is little motion of the surface, indicating that the magma injection is primarily around 1-2 km below the surface in this early stage.
In both maps, I overlaid in green the outlines of the very early lava flows and fissures, from around May 6, in the area of Leilani Estates. The fissures are a bit hard to see because they are small at this scale. I did not include the huge expansion of lava flows that happened later in May.
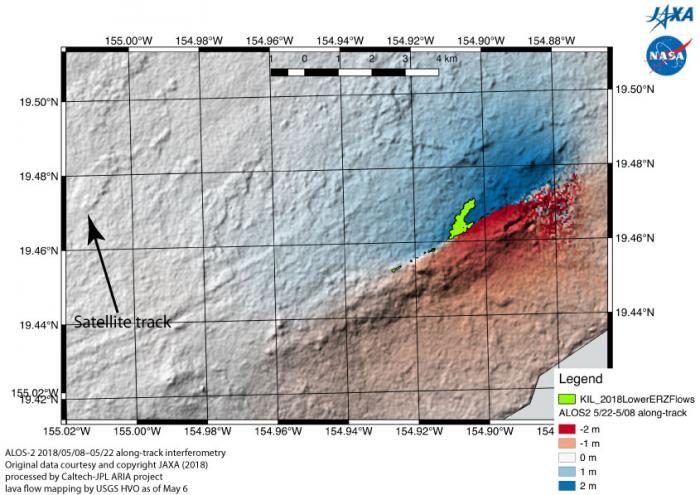
The second map is from ALOS-2 SAR scenes acquired on May 8 and May 22, and it shows the much greater extension across the lower East Rift Zone in the middle of May between the 8th and 22nd of the month. In this map there is no neutral zone in the middle, indicating that the stretching of the surface is nearly as deep and the magma is much more shallow. The total extension (stretching) across the lower East Rift Zone in this 14-day interval is 4 meters.
In both maps the green area outlines the very early lava flows and fissures, from around May 6 2018, in the area of Leilani Estates.