What is the Landsat Program?
The Landsat program is a joint NASA/U.S. Geological Survey (USGS) initiative that provides the longest continuous space-based record of Earth’s land in existence. NASA is responsible for building and launching the satellites while the USGS is in charge of operations and receiving and archiving the data. Every day, Landsat satellites orbit the Earth collecting data on our bodies of water, urban areas, forests, deserts, and other areas of the planet’s surface along the way. Decision-makers across the globe can use this freely available Landsat data to understand environmental change better, manage agricultural practices, allocate scarce water resources, respond to disasters, and more. For nearly 50 years, the Landsat program has changed how we understand our planet and led to more efficient land management and policymaking.
How has the Landsat Program Helped People?
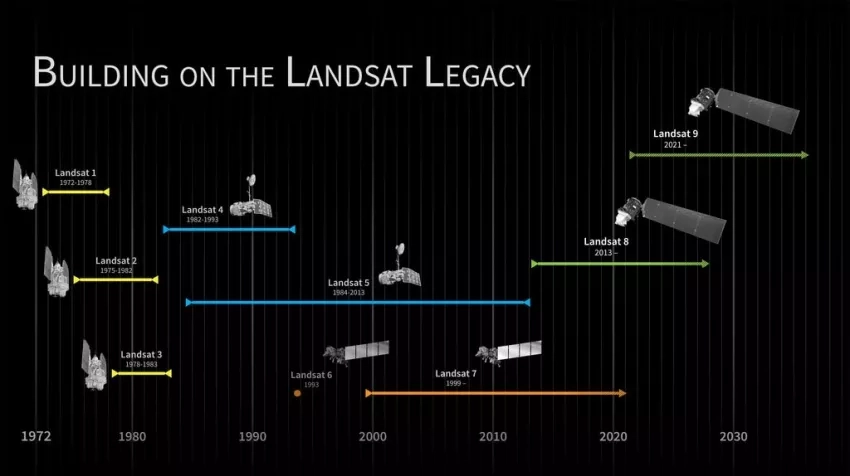
In the summer of 1972, NASA launched Landsat 1, previously called the Earth Resources Technology Satellite (ERTS), to monitor Earth’s surface from space and collect general information on land usage. Since then, the mission has collected more than 8 million scenes of our home planet. When coupled with advanced geographic information systems (GIS), image processing software, and cloud computing capabilities, these scenes enable Landsat users to study changes on Earth’s surface over extended periods. Thanks to Landsat, users can take an image of a specific area from the 1970s and compare it to an image of the same area in the 2020s to understand how land use has changed over the past five decades. Even scenes of our planet taken a few weeks apart can provide valuable insight.
For example, in April 2021, Saint Vincent’s La Soufriére volcano erupted, hurling plumes of dangerous volcanic ash and gas high into the air above the island. Unlike the soft ash you might find in a campfire, volcanic ash has sharp edges and can taint water supplies, smother crops, and collapse roofs. Following the eruption, NASA scientists used information from Landsat 8 to provide decision-makers with imagery showing the impacts of falling volcanic ash on Saint Vincent.

Learn more about how decision-makers used Landsat imagery in the La Soufriére eruption here: Rock and Glass Shards Blanket La Soufriére
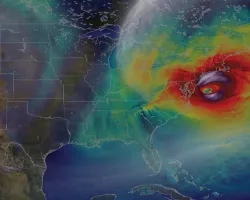
In August 2020, an unusually strong and long-lasting line of thunderstorms – a derecho – battered vast swaths of Iowa and the U.S. Midwest. More than a week after the storm, tens of thousands of Iowans were still without electric power, and many farmers were unsure whether they could salvage crops and repair grain silos before the coming harvest. After the event, NASA used Landsat 8 to identify which areas were damaged. In doing so, Landsat users could pinpoint which areas required immediate assistance and determine the overall effect of the derecho. Both sets of images, La Soufriére and the Iowa derecho were taken a month apart as opposed to decades, yet still proved to be quite valuable for understanding the impacts of the disasters on local communities.
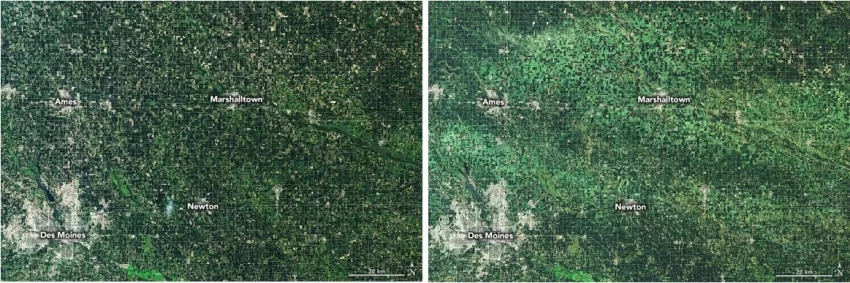
Learn more about how Landsat 8 tracked the Iowa derecho here: Derecho Flattens Iowa Corn
Where are we now with the Landsat Program?
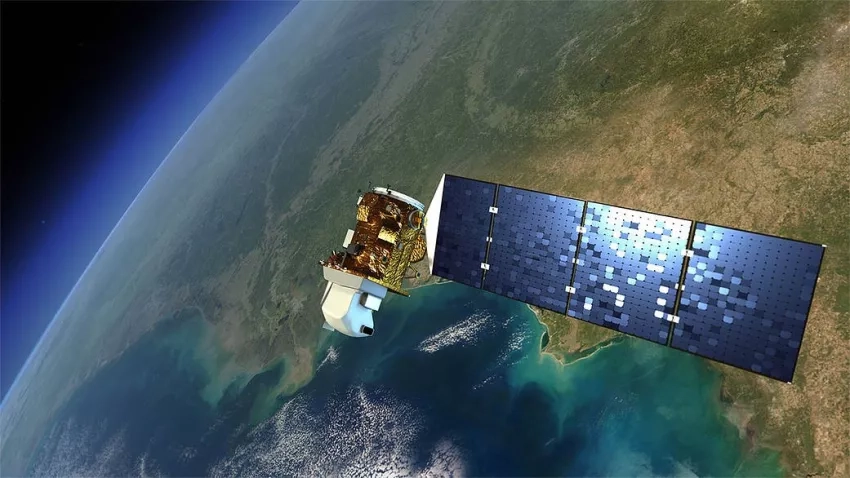
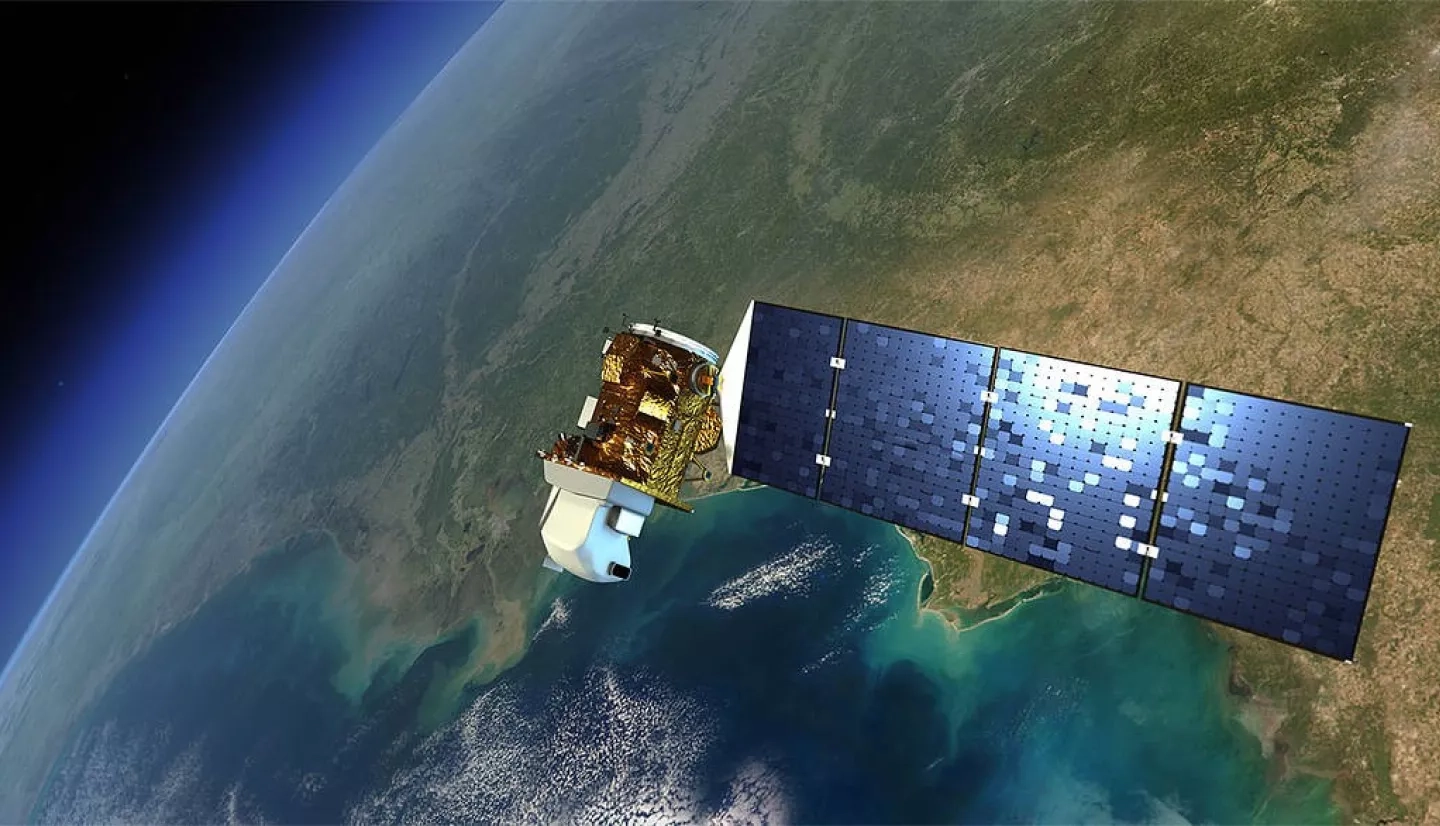
The last time NASA launched a Landsat satellite was in February 2013. This satellite, Landsat 8, consists of two science instruments—the Operational Land Imager (OLI) and the Thermal Infrared Sensor (TIRS). The OLI measures in the visible, near-infrared, and short-wave infrared portions of the spectrum. Its images cover vast areas of the Earth’s landscape while providing sufficient resolution to distinguish features like urban centers, farms, forests and other land uses. The entire Earth falls within view once every 16 days due to Landsat 8’s near-polar orbit. The TIRS measures land surface temperature in two thermal bands with a new technology that applies quantum physics to detect heat and is an invaluable tool for managing water consumption.
The video above describes how Landsat 8 captures images of the entire Earth every 16 days, one large swath at a time. Credits: USGS / NASA
What’s Next for the Landsat Program?
In Sept. 2021, NASA will launch its latest satellite in the Landsat series – Landsat 9. To reduce the build time and a risk of a gap in observations, Landsat 9 will largely replicate its predecessor Landsat 8. The similarities between the two satellites will help maintain consistency among the satellites’ data, as one of the primary advantages of the Landsat series is the ability to look at changes on Earth’s surface over time. Like Landsat 8, Landsat 9 will carry two Earth-observing instruments: OLI-2 and TIRS-2. The OLI-2 will be substantially the same as Landsat 8’s OLI, while the TIRS-2 will improve reliability and correct known issues with stray light on Landsat 8’s TIRS.
Learn More About Landsat 9 Here: Landsat Science
NASA will place Landsat 9 in an orbit that is eight days out of phase with Landsat 8 to take advantage of more frequent Earth observations. With the combined use of Landsat 8 and Landsat 9, observations of any spot on our planet will be available every eight days instead of every 16 days. Furthermore, data from Landsat 9 will be incorporated into Harmonized Landsat Sentinel-2 (HLS) products as they become available from each sensor. The HLS project is a collaborative effort between NASA and other external agencies, including the USGS and the European Space Agency (ESA). HLS takes input data from Landsat satellites and the ESA’s Sentinel-2A and Sentinel-2B satellites to generate a harmonized data product featuring pre-packaged and pre-processed bundles of data products to make the Landsat archive more accessible and easier to analyze. The products reduce the time and effort users need to spend on processing data and makes it possible to analyze observations on the amount of light reflected by the surface of the Earth every two to three days. The combination of Landsat 8 and 9’s eight-day orbit with the HLS project means that in the event of a disaster, Landsat will be able to provide decision-makers with potentially life-saving information faster.
Learn more about the HLS Project Here: Harmonized Landsat Sentinel-2 (HLS)
While the Earth continues to warm, the ability to measure changes in global land surface is becoming more crucial than ever. As leading scientists deliver stark warnings on the deepening climate crisis, people worldwide will look toward Landsat 9 as the latest complement to NASA’s Earth-observing fleet of satellites. The expanded Landsat program will help users make climate-smart land-use and infrastructure decisions – decisions that could mean the difference between their communities coping and thriving.
Landsat Resources:
- NASA Landsat Homepage
- USGS Landsat Homepage
- Landsat 9 Interactive NASA Website
- Virtual Event Aug. 31 - Sept. 2, 2021: USGS National Imagery Summit “Landsat and Society”