The Advanced Rapid Imaging and Analysis (ARIA) team at NASA's Jet Propulsion Laboratory in Pasadena, California, created this map depicting areas that are likely damaged as a result of the recent major earthquakes in Southern California. The color variation from yellow to red indicates increasingly more significant surface change, or damage. The map covers an area of 155 by 186 miles (250 by 300 kilometers), shown by the large red polygon. Each pixel measures about 33 yards (30 meters) across.
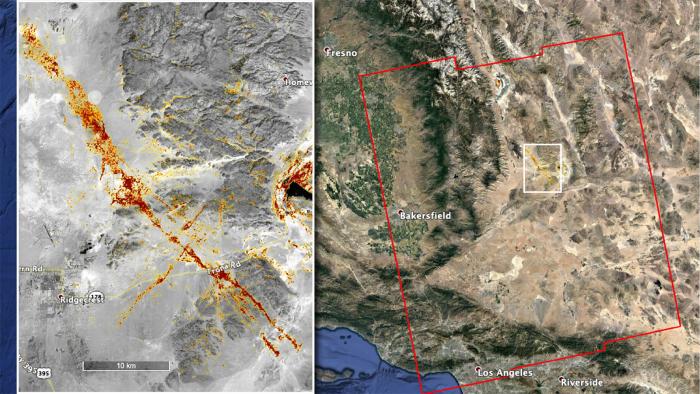
To make the map, the team used synthetic aperture radar (SAR) images from the European Space Agency's Copernicus Sentinel-1 satellites from before and after the sequence of quakes - July 4 and July 10, 2019, respectively. The map may be less reliable over vegetated areas but can provide useful guidance in identifying damaged areas.
These datasets are helping local authorities assess damage and will also provide useful information to engineers for designing resilient structures that can withstand ruptures like the ones created by the latest quakes.