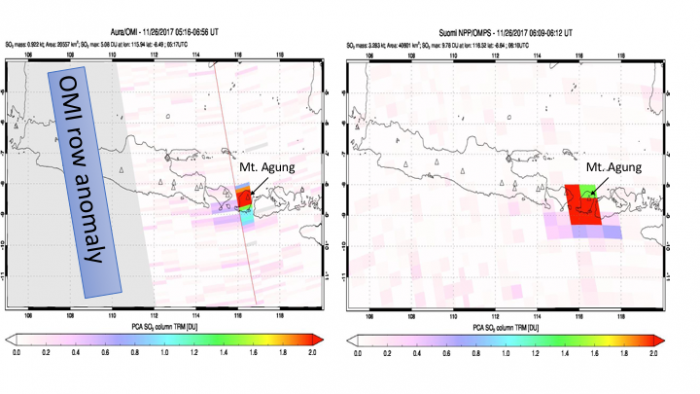
Figure 1 shows volcanic sulfur dioxide (VSO2) plume emitted from the eruption of Mt. Agung (Bali, Indonesia) and first captured by Aura/OMI and SNPP/OMPS UV spectrometers afternoon overpasses on November 26 2017, just hours after the beginning of the explosive magmatic phase of the eruption. The data show total SO2 column amounts in Dobson Units (1 DU = 2.69 1016 molecules SO2 per cm2). Background SO2 concentrations in this location are undetectable from space, providing high confidence in detecting and tracking VSO2 plumes (blue to red colors), which are used as proxy for fine airborne volcanic ash particles presenting hazards to aviation.
Such daily volcanic SO2 (VSO2) maps are automatically created at NASA’s Atmospheric Chemistry Processing system (ACPS) for volcanic regions worldwide (https://so2.gsfc.nasa.gov). OMI UV spectrometer provides higher spatial resolution (13km by 24km at nadir), but currently suffers from partial blockage of the field of view (row anomaly), while newer OMPS Nadir Mapper provides contiguous coverage at lower spatial resolution (50km by 50km at nadir). Both maps are composite of two consecutive orbits processed with consistent Principal Component Analysis (PCA) SO2 retrieval algorithm [Li et al., 2017]. Both OMI and OMPS NRT VSO2 data are injected into multi-satellite European Support to Aviation Control Service (SACS): http://sacs.aeronomie.be/. OMPS Direct Readout VSO2 data also available for local processing by users worldwide (e.g., http://sampo.fmi.fi/volcanic.html ) supported by NASA Direct Readout Laboratory’s International Polar Orbiter Processing Package (IPOPP): https://directreadout.sci.gsfc.nasa.gov/ .
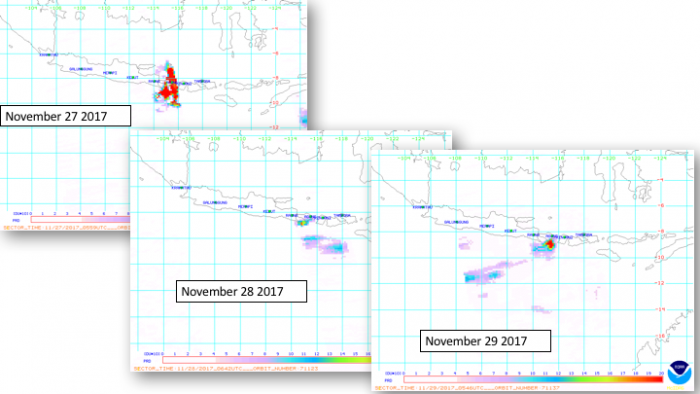
Figure 2 shows NASA’s NRT OMI VSO2 maps for Agung eruption on November 27-29 integrated into NOAA/NESDIS-OSPO operational environment and public web page: http://satepsanone.nesdis.noaa.gov/pub/OMI/OMISO2/index.html
Currently NOAA/NESDIS-OSPO is testing OMPS VSO2 data processing at NDE operational environment and new operational web page for the distribution of the OMPS VSO2 NRT data, similar to OMI. web page: http://www.ospo.noaa.gov/Products/atmosphere/index.html