Imagen


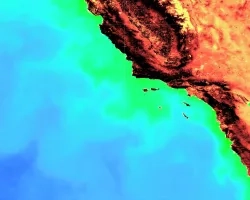
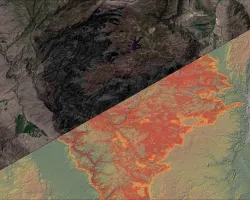
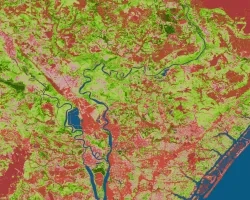
Early harvest information helps drive the national budget in Argentina, providing valuable planning information to identify potential food-insecure regions, anticipate transportation and storage demands, predict price fluctuations, and project commodity trends. However, crop yield estimates are currently subjective, based on interviews with qualified informants (i.e., farmers, agribusiness actors). In partnership with the Buenos Aires Grain Exchange, we leveraged Terra Moderate Resolution Imaging Spectroradiometer (MODIS), Soil Moisture Active Passive (SMAP), and Integrated Multi-satellitE Retrievals for Global Precipitation Measurement (GPM IMERG) NASA Earth observations to develop a Google Earth Engine (GEE) toolset to monitor vegetation growth. The first component of the toolset produces spatial and temporal maps of temperature, precipitation, soil moisture, and the Normalized Difference Vegetation Index (NDVI), allowing users to visualize the influence of the region’s climate and weather. Next, we developed an autoregressive model to predict NDVI several months in advance. Lastly, we created a linear regression model of crop yield and NDVI for soybeans, corn, and wheat, and input the forecasted NDVI to generate a predicted crop yield output. The NDVI model had an RMSE of 0.074 and at Zone 6 produced an R2 of 0.99, 0.89, and 0.54 at two, four, and six months, respectively. The crop yield model produced an R2 value of 0.84, 0.90 and 0.005 respectively for soybeans, corn, and wheat in Zone 3 after model calibration. This information is vital for vegetation growth monitoring by identifying areas of high growth and allocating resources to areas of lower growth to efficiently maximize crop yields.