Imagen
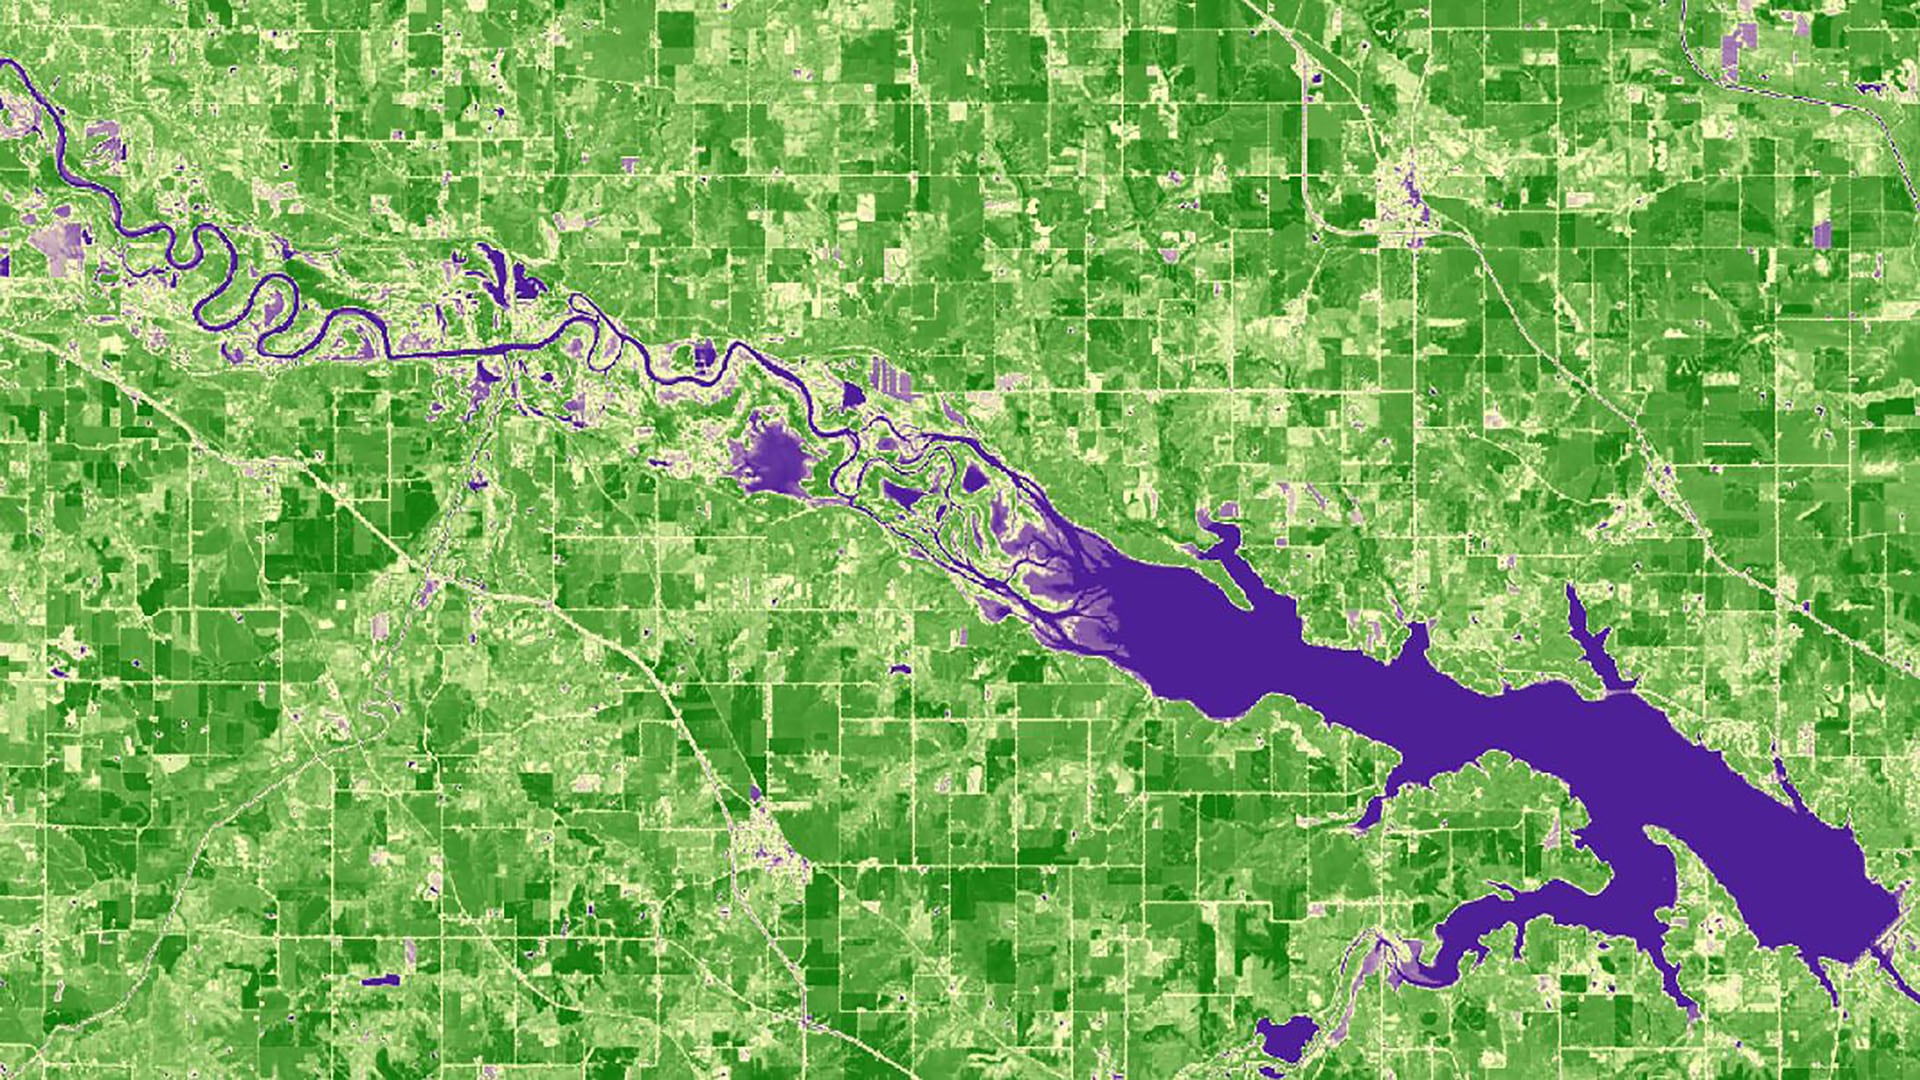
Farmers across Iowa, Minnesota, and Wisconsin have access to accurate and ample phenological data for large-grain crops like corn and soybeans. These data are useful metrics that describe changes during different stages of crop growth which help farmers evaluate crop success during growing seasons. The abundance of large-grain crops and widespread data allows for sufficient insurance coverage on these types of crops, but small-grain crops like barley, oats, rye, and wheat get little to no coverage due to limited data. The lack of insurance opportunities beyond large-grain crops has deterred small-grain crop cultivation and decreased opportunities for diversification. Without this crop diversity, issues such as limited soil nutrients, increased soil disease, and possible decreased yields become more prevalent. In partnership with the Practical Farmers of Iowa, NASA DEVELOP worked to provide accessible data for its clients in order to encourage crop diversification by utilizing historical and current data for cost sharing and insurance opportunities. Within the Google Earth Engine platform, the DEVELOP team used Landsat 7 Enhanced Thematic Mapper Plus (ETM+) and Landsat 8 Operational Land Imager (OLI) to create a framework for generating a series of phenological curves for small-grain crops to support farmers interested in diversifying their crops with attaining insurance coverage. Additionally, the team used the Gridded Surface Meteorological (gridMET) dataset to create climatological curves of precipitation and temperature for farmers to compare with the phenology curves in order to understand the effect of weather conditions on the growth of their crops.