Team: Peter Ibsen (US Geological Survey), Priyanka DeSouza (UC Denver), Jay Diffendorfer (US Geological Survey), Travis Warziniak (US Forest Service), Cody Bingham (University of British Columbia), Logan Steinhardt (University of British Columbia), Carl Green (Denver Regional Transportation District
Summary: The combination of extreme heat and urban air pollution has drastically increased mortality and morbidity in cities. While recent studies have explored how to reduce heat and air pollution at a citywide or a neighborhood level, finer scale patterns are of great importance to human well-being. When individuals are exposed to extreme temperatures and harmful airborne pollutants at finer scales, their patterns of activities may shift to avoid negative health-impacts. This is especially the case at transit stops where individuals must spend time exposed to the outdoor environment. Furthermore, as public transit is disproportionately utilized by lower-income populations these health impacts and changes to activities can be inequitably distributed. Given the increased risks of extreme urban climates, our goal is to explain links between patterns of land cover, heat, and air quality, and how this understanding could influence human decision making. We therefore pose a simple and overarching research question: How do patterns in urban land cover drive microclimate and air quality at transit stops and human decision making?
In collaboration with Denver RTD, we will determine relative transit stop usage and ridership data in relation to neighborhood and microscale thermal comfort air quality. We hypothesize transit stops with a greater proportions of tree canopy, other vegetated land cover, and amenities will have lower instances of extreme surface and air temperatures and concentration of air pollution. However, as exposure to extreme heat and air pollutants increase, there will be an inequity in transit ridership. Higher-income households have more flexibility in transportation options; they are more likely to take other modes of transport on high-heat days or adjust their commuting times. In lower-income neighborhoods ridership will not decrease, even when individuals are expressing low thermal comfort levels, due to the lack of other ridership options.
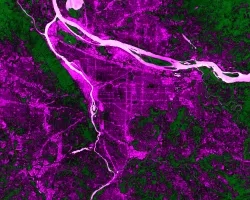
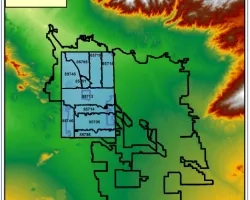
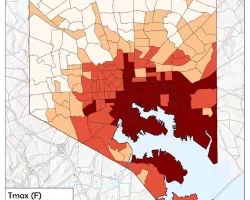
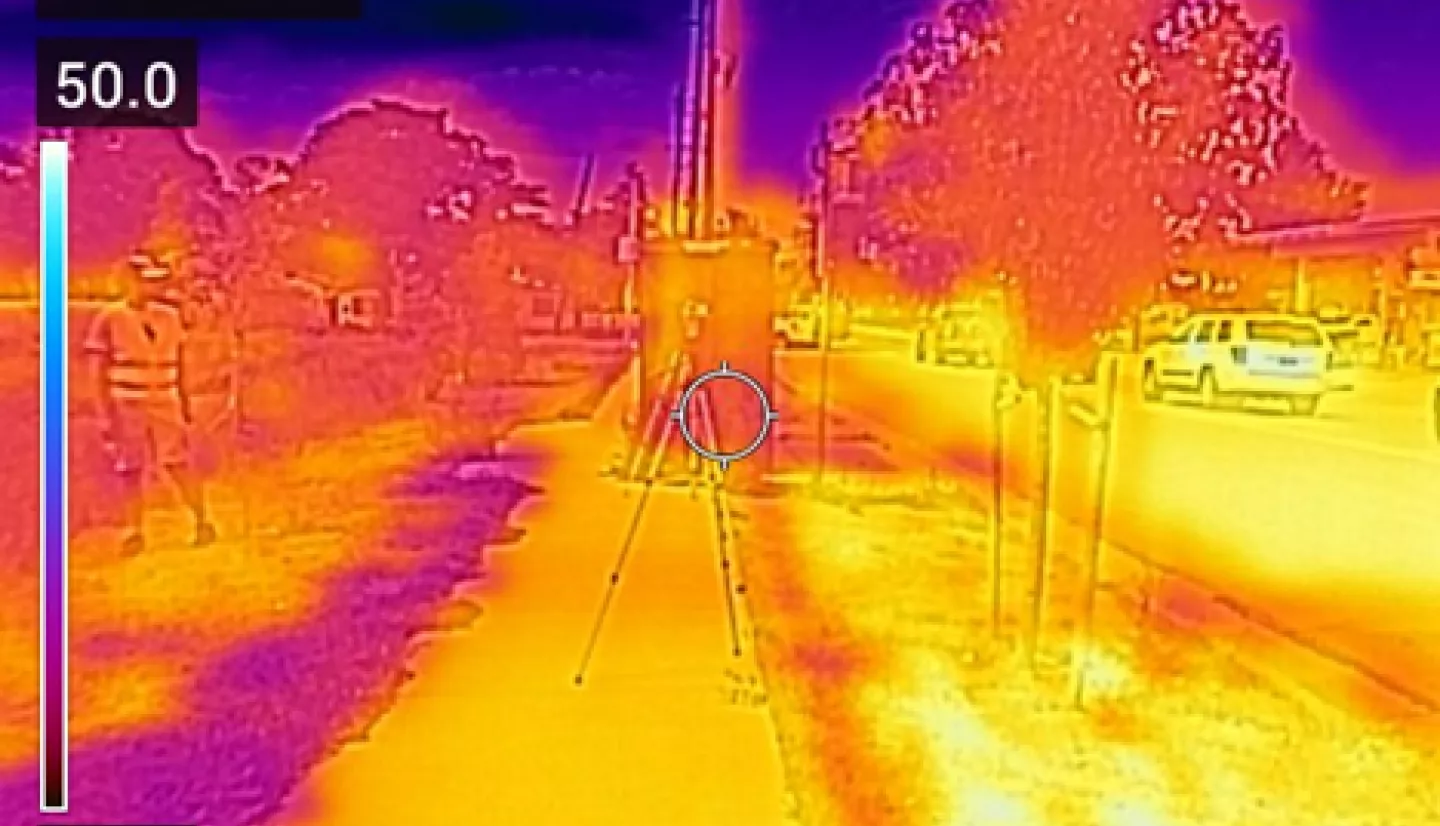
We test our hypothesis through a synthesis of satellite derived surface temperature and vegetation data (30 m), high-resolution land cover data (1 m), handheld sensors collecting mean rad, census income and racial demographic data, and location and ridership data for transit stops in the Denver metro region. Our sensors record both air and surface temperature, as well as local concentrations of PM2.5 and NO2, which are air pollutants with strong impacts to health, and major sources of vehicle emissions. Using satellite and local sensor data in conjunction with census demographics, our study scales the landcover drivers of urban health hazards across spatial and social gradients.
Related Impact