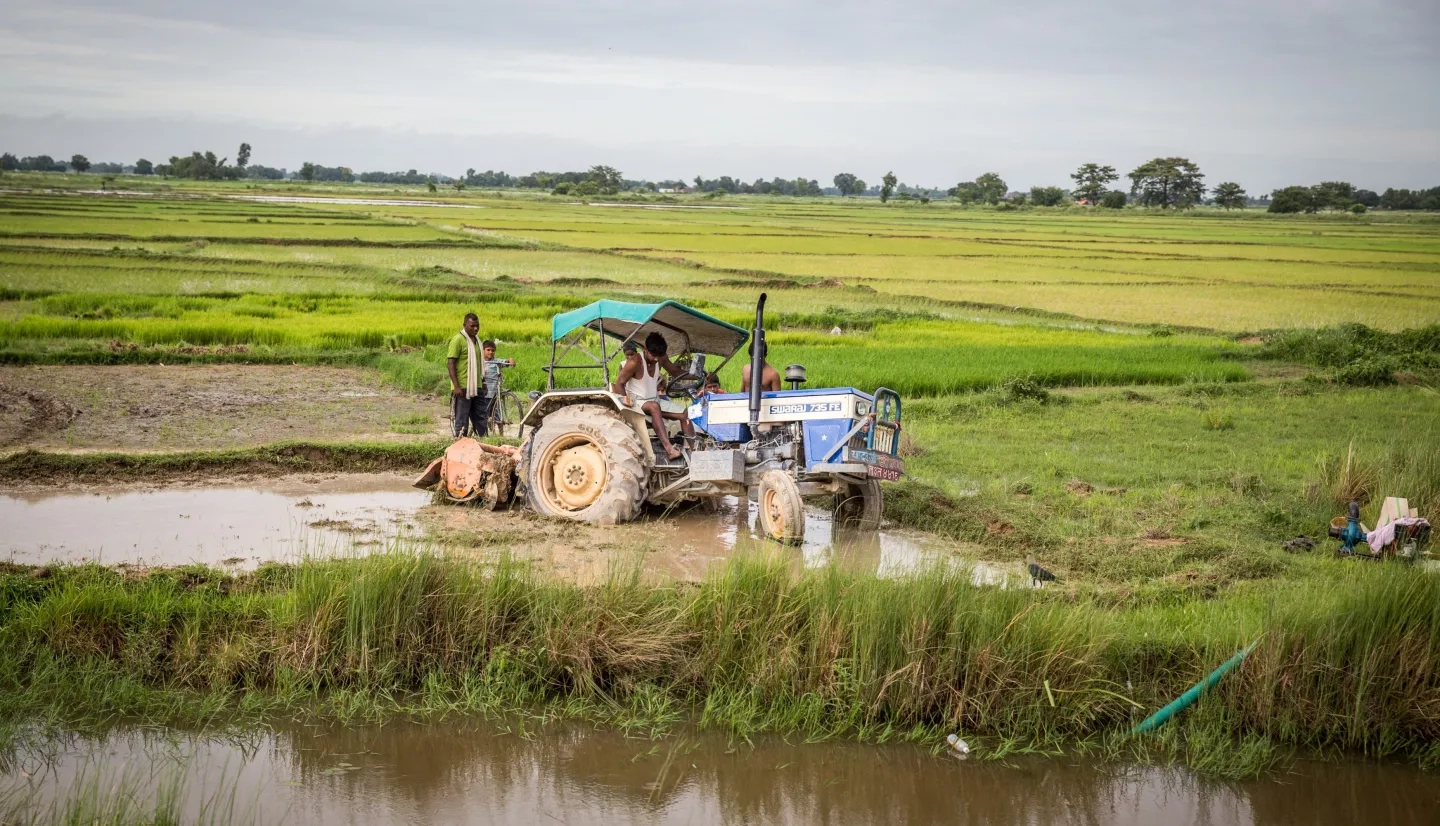
In the low-lying Terai region of Nepal, fields of emerald green rice sweep across the landscape as far as the eye can see. Villages dot the region, which produces the majority of Nepal’s rice. These communities depend on an increasingly volatile climate to produce food for their families and regional economy. With floods destroying crops and livelihoods, aid agencies need a tool for mapping and monitoring rice conditions so they can provide resources when needed.
“In the Hindu Kush Himalaya, more than 30% of the population suffers from food insecurity and around 50% face some form of malnutrition, with women and children suffering the most,“ said Dr. Faisal Mueen Qamer, a remote sensing specialist at the International Centre for Integrated Mountain Development (ICIMOD) in Kathmandu, Nepal.
Monitoring rice fields in South Asia is usually a challenging and time consuming process. In Nepal, field officers interview farmers to determine changes in crop areas. They use that data to inform statistics at the Ministry of Agriculture and Livestock Development (MoALD). Keeping agriculture statistics up to date is key to managing food security. According to the ministry, local agriculture makes up 61% of jobs in Nepal, and there is a need for a more cost effective and reliable rice monitoring method to better support communities. This is where the SERVIR program helps agencies use remote sensing to fill the gap.
“National agencies that report crop statistics and yield assessments still use conventional land-based surveys, statistical sampling techniques, and baseline data from three decades ago,” Qamer said. “The absence of robust data and data sharing mechanisms hinders evidence-based policy making.”
SERVIR is a joint program of NASA and the U.S. Agency for International Development. In Nepal, the regional SERVIR hub is located at ICIMOD, which works to train personnel from the region on the use of Earth observations in crop management.
Dr. Liping Di is the director of the Center for Spatial Information Science and Systems at George Mason University. He is also a principal investigator with SERVIR’s Applied Sciences Team. An expert in crop mapping, he is the lead researcher partnering with the USDA to create CropScape. This app is used to generate official agricultural statistics in the US. Since 2019, Di and his team have created many products to improve rice mapping in Nepal.

New Tools of the Trade
Di adds that there are many challenges to mapping rice in Nepal, such as a lack of on-the-ground data collection. This limits the information available to train crop models and validate automated crop-mapping tools. Small field sizes also make it difficult to distinguish crops in satellite imagery and there are mixed crops which can confuse computer models. To combat these challenges, the team developed a suite of tools to map rice area and evaluate the crop condition.
“The tools my team designed work together to map rice in the region and disseminate the map to end-users smoothly. These tools include GeoFairy for ground truth collection, RiceMapEngine for in-season and postseason rice mapping,” Di said. “There is also CropScape for dissemination of rice maps and crop growth condition information."
The process starts with GeoFairy. It is a mobile app that makes it easy for farmers to collect data about the health of their rice crop with just a phone. Agricultural personnel use SERVIR’s Rice Map Engine application to combine field data from GeoFairy, satellite data, and crop trends to produce a final rice map. In the mountains it is more difficult to interpret satellite imagery. Their analysts use the CropScape tool to review seasonal vegetation anomalies to understand crop conditions. By using these applications together, communities and scientists get better estimates of how much rice is being produced across a wide area and keep an eye on crop health.

Growing Rice, Growing Data
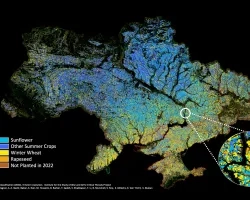
In 2019 the SERVIR team guided a pilot project of these methods in the Chitwan district of Nepal. Chitwan is located along Nepal’s southern border in the Terai region where 75% of the country’s rice is grown. The SERVIR team found that across the Terai––the tool was accurate enough to identify rice fields 9 times out of 10. Though the application still struggles to measure rice in smaller, more mountainous farms, the Nepalese ministry now accepts using this method for large-area rice mapping.
“In the Ministry of Agriculture and Livestock Development, accurate data on agricultural production–including crop yields, area cultivated, and production trends–is critical for policymakers to better understand the sector's performance and [to develop] strategies to increase yields,” said Ram Krishna Regmi, chief of Statistics Section at MoALD. “Our collaboration with ICIMOD on employing Earth observation data for in-season crop assessment has produced promising results in improving accuracy and efficiency of our assessments.“
SERVIR continues to develop these methods to decrease time spent in the field. Recently, SERVIR’s Hindu Kush Himalaya team at ICIMOD have shared these methods with partners in Bangladesh and Pakistan. The goal with these new techniques is to create more time-efficient options for rice mapping, helping decision-makers to support farm communities preparing for the challenges of a changing climate.
Banner photo credit: ICIMOD, Jitendra Raj Bajracharya