Start Date: Jan. 10, 2025
Type: Wildland Fires
Region: Los Angeles County, North America
View Products on the NASA Disasters Mapping Portal
NASA Disasters Program Resources for Fires
What DHS and FEMA are doing: https://www.fema.gov/california-wildfires (Spanish: https://www.fema.gov/es/california-wildfires)
What the U.S. government is doing: https://www.usa.gov/california-wildfires (Spanish: https://usa.gov/es/california-incendios-forestales)
Update Jan. 17, 2025
As wildfires continue to blaze in Los Angeles County, the Disasters Response Coordination System is supporting partners’ response efforts including the California Governor’s Office of Emergency Services (CalOES), the Los Angeles County Office of Emergency Management, and FEMA. DRCS team members are participating in coordination calls hosted by FEMA and CalOES to assess needs and share resources.
The DRCS is producing and sharing unique maps and data products to aid emergency responders in understanding the fires impacts, including products to assess burned areas, ash coverage, air quality, and methane emissions. Products recently shared include high resolution Planet Labs optical imagery, astronaut photographs of the region from the International Space Station, and ECOSTRESS land surface temperature imagery. For a full list of NASA Disasters Program products for the Southern California wildfires and their potential uses, click here.
AVIRIS-3 Hyperspectral Imagery & Ash Maps

Credits: Rob Green (JPL), Phil Brodrick (JPL), David Thompson (JPL), John Chapman (JPL), Michael Eastwood (JPL), and Adam Chlus (JPL)
This swipe app shows data collected by NASA’s AVIRIS-3 instrument, which surveyed the fires during flights conducted on Jan. 10 and 16, 2025. AVIRIS-3 collected hyperspectral imagery at 3-4 meter resolution, which can be used to identify specific hazardous materials such as ash. As an airborne instrument, it can collect higher resolution imagery over specific targeted areas compared to satellite imagery, which typically collects lower resolution imagery over broad areas. Together, satellite and airborne instruments can provide a more complete picture of the fires’ impacts.
The AVIRIS team at NASA’s Jet Propulsion Laboratory at the California Institute of Technology used the hyperspectral imagery to create an ash fraction map which shows the relative amount of char and ash within each 3-4 meter pixel. On the left, this swipe map shows false color AVIRIS imagery overlaid with the ash fraction map. The right side shows the original AVIRIS imagery used to create the ash map.
This ash fraction map provides situational awareness on the location of hazardous ash, which can inform debris removal and hazardous materials mitigation operations. Additional spectral analysis can help identify other hazardous materials around the burned areas, such as methane gas leaks and asbestos.
Copernicus Sentinel-2A True Color and Infrared Imagery of Burn Scars

Credits: NASA/MSFC, USGS, ESA Copernicus
The three images above compare imagery collected by the Copernicus Sentinel-2A satellite, showing how different instrument bands and processing methods can help response agencies understand different aspects of the fires’ impacts on Los Angeles County. The top pane shows true color imagery, similar to what our eyes would see. This is overlaid with the NASA Earth Information System Fire Event Data Suite data from Jan. 13, with orange areas indicating the modeled extent of active fires.
In the middle pane, the same Sentinel-2 imagery has been modified to replace green signatures with those in the near-infrared part of the spectrum. This allows users to more easily identify burn scars in the landscape, which appear brown, and differentiate it from healthy vegetation, which appears red. Burn scars are areas of land that of land that have been left charred and stripped of vegetation after a wildfire, which can increase the risk of flooding and debris flow.
The third pane shows the same image processed using the Normalized Burn Ratio, an analysis that compares the intensity of light reflected in the near-infrared and short-wave infrared spectral bands. In this grayscale image, burn scars are readily visible as expansive black areas. This allows for easier identification of burned areas to aid awareness for response and recovery efforts. This allows for easier identification of burned areas to aid awareness for response and recovery efforts.
Copernicus Sentinel-1 Change Detection Maps of Damaged BUILDINGS & Infrastructure

Credits: Damage analysis of Copernicus Sentinel-1 satellite data by Corey Scher of CUNY Graduate Center and Jamon Van Den Hoek of Oregon State University.
This map shows likely damaged structures around the Palisades Fire in Malibu and the Eaton Fire in Altadena, with damaged structures showing as red for the Palisades fire and orange for the Eaton fire. This map uses a technique called coherent change detection analysis to process interferometric synthetic aperture radar (InSAR) imagery collected by the Copernicus Sentinel-1 satellite on Jan. 9 (Eaton Fire) and 14 (Palisades Fires). Coherent change detection analysis can show change across the entire satellite collection area, which includes vegetation and forested areas. To make this more useful for response agencies, this imagery has been constrained to FIRIS fire perimeters to highlight the damage to buildings and infrastructure only.
Earlier versions of these rapid damage analysis maps were published by major news organizations, including the New York Times and Financial Times, bringing additional public awareness to the extent of infrastructure loss from the blazes. These were developed by Corey Scher of CUNY Graduate Center and Jamon Van Den Hoek of Oregon State University, based on research supported in-part by the NASA Disasters Program.
Update Jan. 14, 2025
At the requests of the California Governor’s Office of Emergency Services (CalOES), the Los Angeles County Office of Emergency Management, and the Federal Emergency Management Agency (FEMA Region 9), the NASA Disasters Program has activated the Disasters Response Coordination System (DRCS) for multiple ongoing fires in Los Angeles County, California.
Since Jan. 7, several major wildfires have swept through in Los Angeles County in California, as strong Santa Ana wind gusts stoke the blazes. Fires in the area still burning as of Jan. 13 include the Palisades Fire, in and around Pacific Palisades, Eaton Fire, on the city’s east side, near Pasadena, and Hurst Fire to the north, near San Fernando.

The Disasters Response Coordination System is sharing maps and data to aid partners in identifying burned structures and critical infrastructure, fire extent, air quality, and other impacts the fires are having on the community. The DRCS are sharing products directly with partners and are also sharing them on the NASA Disasters Mapping Portal as they become available.
These products may help assess and characterize:
- Impact to homes and infrastructure, including but not limited to:Multispectral imagery (Sentinel 2, Landsat, Maxar analysis) - for burned area analysis and awareness of possible impacts to infrastructure.
- Hyperspectral imagery (AVIRIS) - aerial methane emissions data to identify potential gas leaks.
- SAR (Sentinel 1 changed detection analysis) – for mapping potential infrastructure damage.
- Black Marble - nighttime lights near real-time data for power outage awareness.
- Impacts to air quality and human health, including but not limited to:TEMPO – to understand emissions and adverse health risks.
- Methane emissions (AVIRIS, GHGsat)
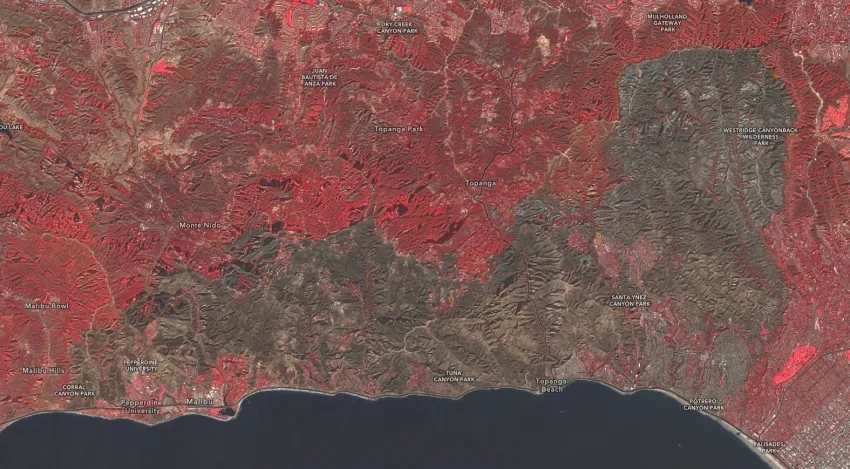
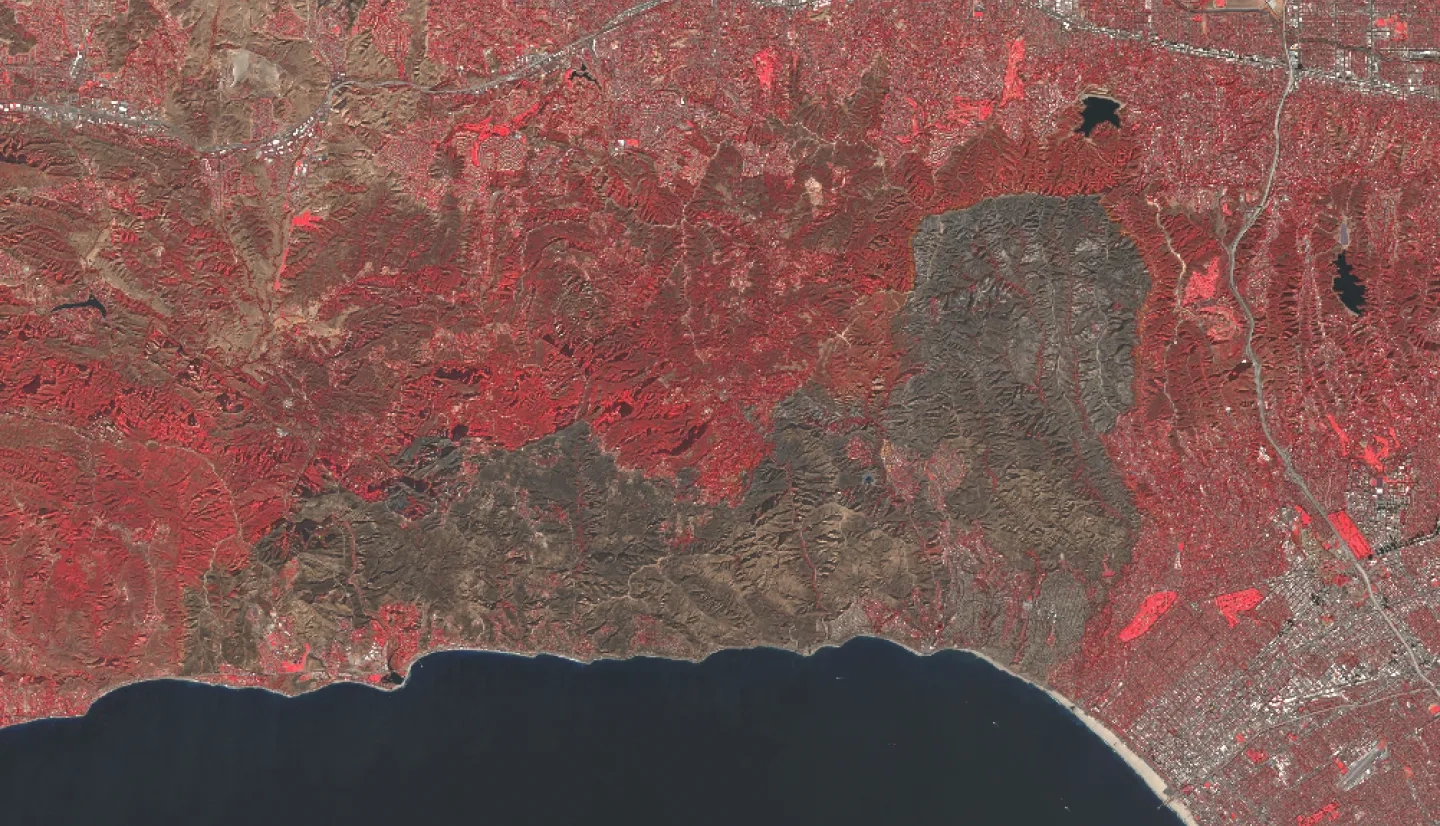
These color infrared composite images derived from Copernicus Sentinel-2A satellite data from Jan. 12, 2025, show impacts of the Palisades Fire in Malibu, CA (above & banner image) and the Eaton Fire in Altadena, CA, (below). In these images, red areas indicate healthy vegetation and blue indicate water, while burned areas are shown in gray and black. Infrared imagery such as these can help emergency management officials identify fire hot spots at the time of the overpass and areas burned by the fires, allowing them to see damage to regions that may be obscured by thin smoke which can block other types of sensors.

More on the Southern California Wildfires
- NASA Earth Observatory: