Start Date: Dec. 7, 2025
Type: Floods, Landslides
Region: Washington State, North America
View Maps & Data on the NASA Disasters Portal
UPDATE DEC. 11, 2025
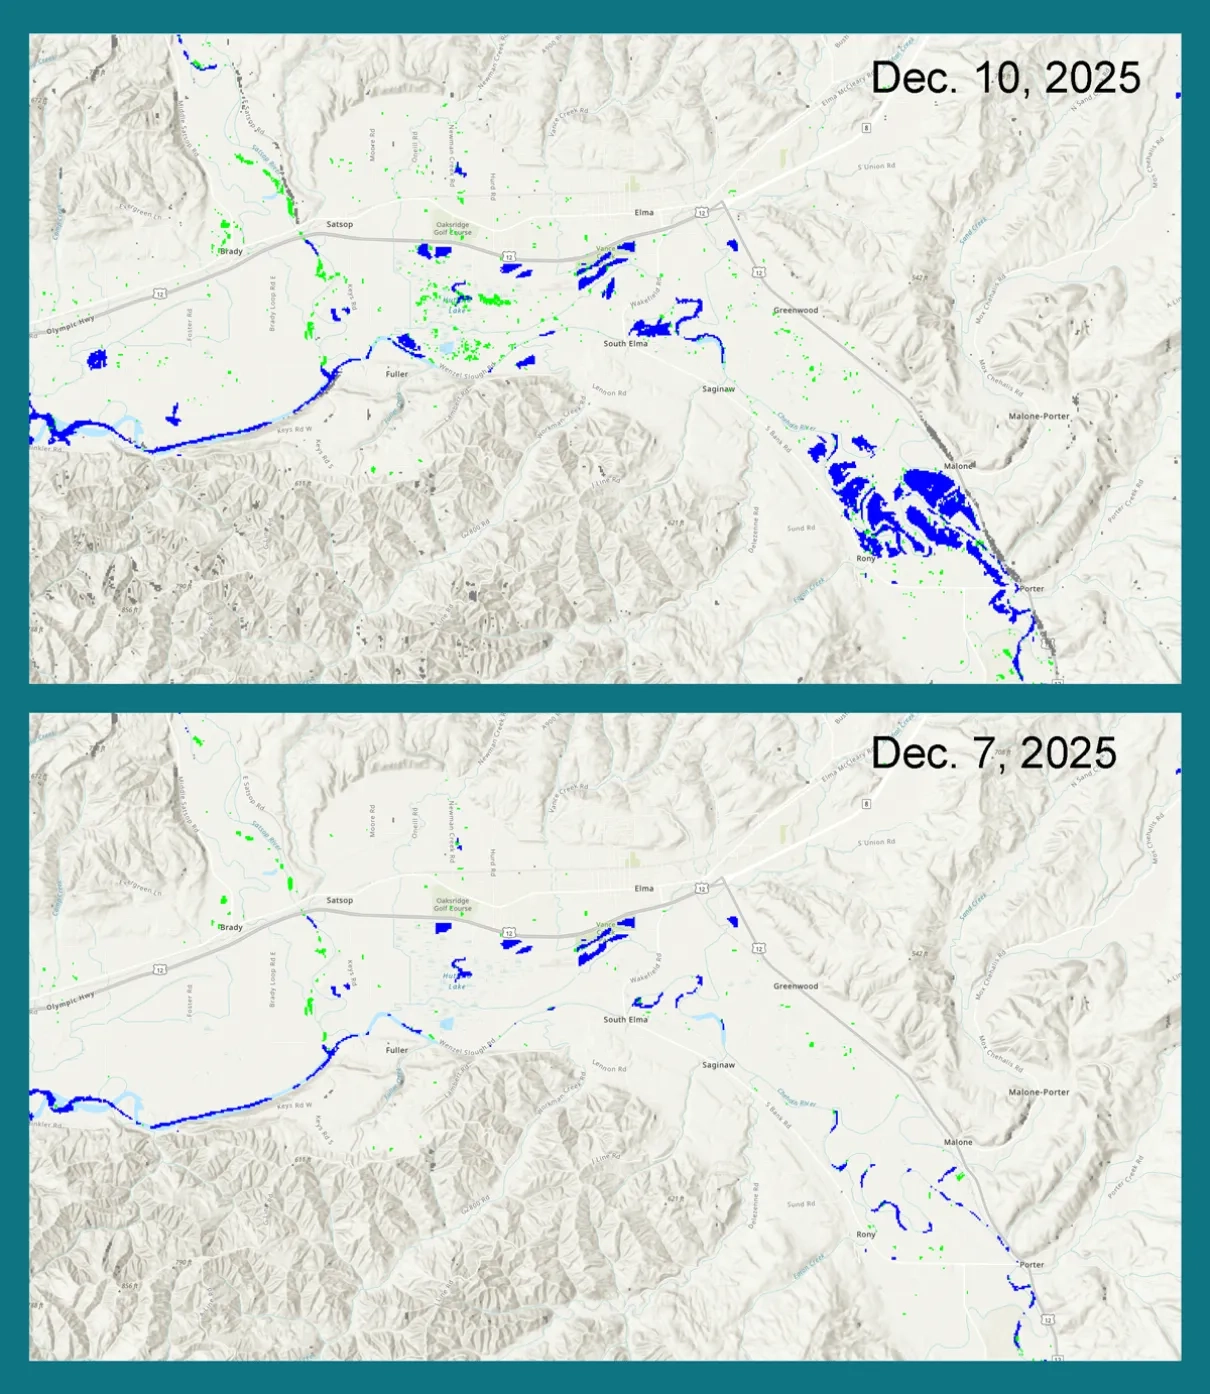
A series of strong atmospheric rivers has recently impacted Washington state, bringing several days of intense rainfall and heavy mountain snow. The resulting flooding has pushed major rivers toward or above record levels, triggering evacuations, power outages, and widespread road closures across western Washington. Communities in the region are facing significant disruptions as officials respond to inundated neighborhoods and heightened landslide risks.
The NASA Disasters Program’s Disasters Response Coordination System (DRCS) has activated to support ongoing response efforts by the Washington State Emergency Operations Center. The DRCS team has shared several near-real time products, including NASA IMERG precipitation rates to help track rain and snowfall, and landslide forecast and exposure maps to help response teams assess the threat of landslides in the region. The NASA team has also developed multiple satellite-based products to assess flood extent, including optical and synthetic aperture radar-based products, and products to assess areas at higher risk of landslides due to recent wildfires.
The DRCS is coordinating with response partners and sharing new maps and data to the NASA Disasters Portal as the situation evolves.