Geographic information systems, known as GIS, is a standardized data framework that allows for gathering, analyzing and visualizing geographic data of all types.
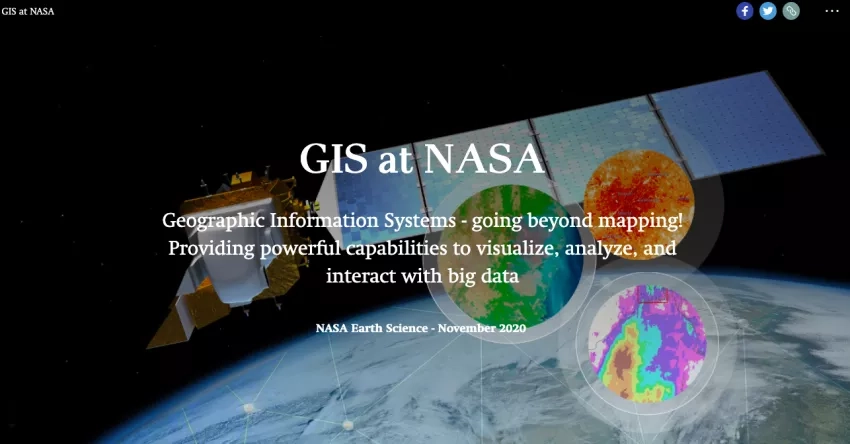
GIS Day is November 18, 2020 and it's an international celebration of GIS technology. Going beyond mapping, GIS provides powerful capabilities to visualize, analyze, and interact with big data.
At a GIS Day event hosted by the international GIS company Esri, Disasters Program Manager David Green presented the keynote address. It is part of a day-long international event hosted by European Esri/Bulgaria with the theme of "How GIS Supports Society." Esri notes that Disasters demonstrates that modern GIS improves collaboration, mitigation and response to natural and social disasters.
NASA uses GIS to enhance our awareness/intelligence of our world. GIS plays a crucial role with managing, understanding, and sharing Earth observations. The standardized format of GIS enables easier sharing of knowledge between organizations, and lets users combine multiple datasets to reveal deeper insights, such as patterns, relationships, and situations – ultimately allowing them to make smarter decisions. By participating in GIS day, NASA raises awareness of the value of GIS technology for solving society’s most pressing issues.
GIS at NASA
NASA Disasters Portal
The Disasters program area has pioneered the use of GIS technology for NASA Earth observing data with its Disasters Mapping Portal, making the data easier to access for local disaster management agencies, and processing, analyzing and visualizing the data to inform risk reduction, resilience and recovery efforts for disasters around the world.
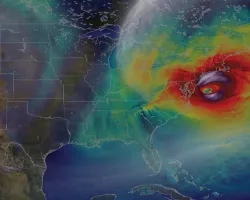
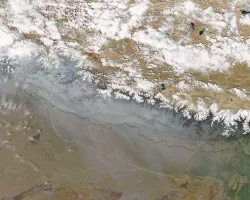
To help celebrate GIS day, the Disasters GIS team has assembled a Story Map titled GIS at NASA. It highlights some of the most unique and notable usages of GIS data from across the NASA Earth Science Division. These include a 3D visualization of Multi-angle Imaging Spectroradiometer (MISR) smoke plume data from the 2019 / 2020 Australian fires, and a damage proxy map (DPM) of Beirut, Lebanon showing regions likely damaged by the August 2020 explosion, combined with photographs taken from the International Space Station (ISS).
In addition to the keynote address to the European Esri/Bulgaria event by the lead of the Disasters program area, Laura Phoebus, a GIS Specialist with Disasters is presenting to an internal NASA audience during a "Lunch and Learn" event on the Disasters Mapping Portal.
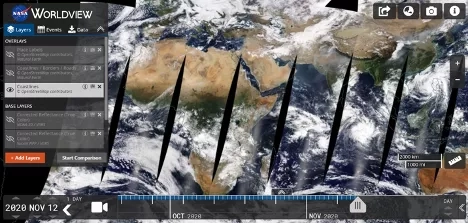
Worldview
The Worldview tool from NASA's Earth Observing System Data and Information System (EOSDIS) provides the capability to interactively browse over 900 global, full-resolution satellite imagery layers and then download the underlying data.
These services are also being made available through the Living Atlas of the World, a global collection of geographic content created by the company Esri.
COVID-19 Dashboard
In an unprecedented collaboration, 3 space agencies have created the joint COVID-19 Earth Observation Dashboard, integrating multiple satellite data records with analytical tools to allow tracking of changes in air and water quality, climate change, economic activity, and agriculture.
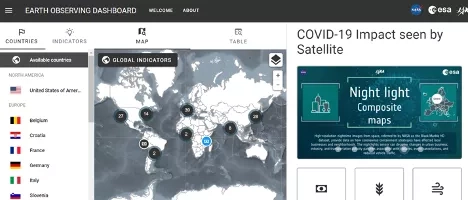
NASA’s Socioeconomic Data Applications Center (SEDAC) also created a COVID-19 global viewer with population estimates.
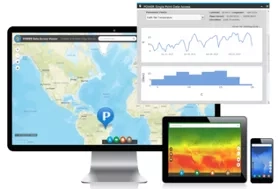
State of the Ocean
NASA's State of the Ocean interactive tool promotes discovery and analysis of oceans through interactive maps, animations and plots.
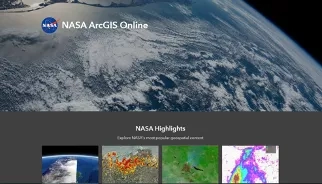
Geospatial Content
Explore NASA geospatial content and build maps using NASA's data online: https://nasa.maps.arcgis.com/
Energy Resources
NASA's Prediction of Worldwide Energy Resources (POWER) program includes a data viewer and web services, providing data subsetting, charting, and visualization tools for renewable energy in an easy-to-use interface.
Making Waves by Combining GIS and Synthetic Aperture Radar (SAR)
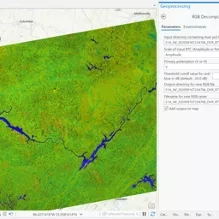
Synthetic Aperture Radar (SAR) is a powerful remote sensing tool that is making waves in Earth science. By sending out a radar signal and measuring its return, SAR is an active type of data collection making it a compliment to GIS. NASA's Alaska Satellite Facility downlinks, processes and distributes remote-sensing data to scientific users around the world. It offers on-demand Sentinel-1 Radiometrically Terrain Corrected datasets. This makes analysis-ready SAR data available to anyone, and the updated ArcGIS toolbox is optimized for use with these products.
Training
NASA’s Applied Remote Sensing Training (ARSET) program provides training into using GIS to visualize and analyze remote sensing data.
Expanded Access
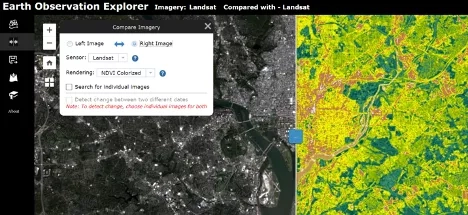
Explore NASA Earthdata is an authoritative ArcGIS Image Service Provider at the Living Atlas Earth Observation Explorer. The Earth Observation Explorer app provides different bands of the Sentinel-2 and Landsat series of satellites to better explore the planet's geology, vegetation, agriculture and cities. Additionally, it provides access the Sentinel-2 and Landsat archives to visualize how the Earth's surface has changed over time.
For more information, please view the Earthdata website: Learn GIS.