National Public Health Week is April 1-7, 2019, and NASA Earth Science Division is committed to collaborative projects that apply Earth science satellite imagery and data to encourage community engagement in environmental and public health issues. We partner with other agencies, local governments, and academia to provide the latest resources and tools to empower community members to take precautions that safeguard their health.
Here are a few recent examples of public health projects from NASA Earth’s Applied Sciences Program:
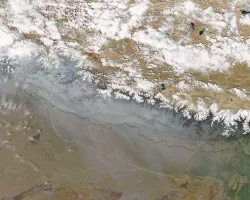
Predicting Dangerous Red Tides:
Along the coastal waters, “red tides” can result from the accumulation of the dinoflagellate Karenia brevis, which are toxic to human and marine health. In Florida, NASA’s Health and Air Quality Applications area partnered with the Florida Fish and Wildlife Conservation Commission, the Gulf of Mexico Coastal Ocean Observing System, the National Oceanic and Atmospheric Administration (NOAA), the Pinellas County Environmental Management, and the University of South Florida to help the public and coastal workers be aware of the daily risk of red tide toxins. Data from NASA’s Terraand Aqua satellites and the European Space Agency’s Sentinel-3 satellite were used in conjunction with the HABscope smartphone app for video uploads by citizen scientists to map the extent of algal blooms along the Florida’s Gulf Coast. With updates on the harmful algal bloom forecasts on a mobile app, factsheet distribution, and physical warnings along the coast, beachgoers can understand their risk and take appropriate precautions. For more information, please read this NASA story.

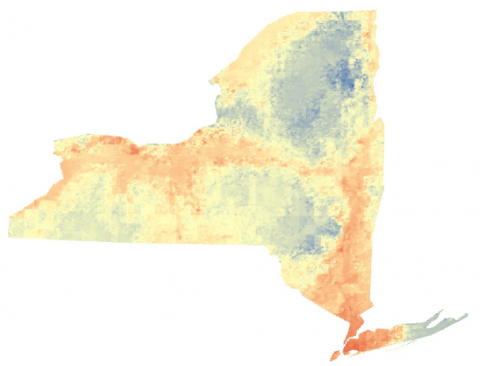
Helping New Yorkers Keep Their Cool:
Extreme summer temperatures can cause grave health consequences, including dehydration, respiratory and cardiovascular illness, and reduced renal function. In New York, NASA Earth’s Health and Air Quality Applications area filled a vital gap of information by collaborating with the National Weather Service (NWS) and the New York State Department of Health. This partnership project matched daily emergency room visits with fine-scale temperature data from the NASA-sponsored North American Land Data Assimilation System (NLDAS). These data showed that harmful health effects were occurring at lower temperatures than the New York’s heat advisory threshold of 100⁰F. As a result, starting in the summer of 2018, the NWS lowered the heat advisory temperature threshold to 95⁰F in New York to give citizens the warning they need to keep cool and protect their health.
Understanding Your UV Exposure Risk:
Prolonged exposure to ultraviolet (UV) radiation from the sun can alter the structure of skin cells and produce harmful health effects. In the U.S., melanoma causes over 75 percent of skin cancer deaths – about 9,500 per year. Last year, in collaboration with the Centers for Disease Control and Prevention (CDC) Environmental Tracking Program, NASA Earth’s Health and Air Quality Applications area used the Ozone Monitoring Instrument (OMI) surface UV data from NASA’s Aura spacecraft to map UV exposure across the country. These data can better inform public health authorities in their decision-making as well as help the public understand local risks of sun exposure.

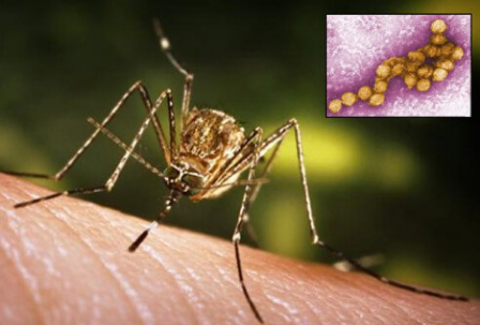
Giving an Early Warning:
In South Dakota, the state with the highest per capita incidence of West Nile Virus (WNV), NASA has helped develop an early warning system for this dangerous disease. NASA’s Health and Air Quality Applications area partnered with South Dakota State University (SDSU) and the South Dakota Department of Health (SDDOH) to produce a weekly risk forecast – incorporating NASA’s North American Land Data Assimilation System (NLDAS) and Soil Moisture Active Passive (SMAP) satellite data into a WNV risk prediction system. Last year, SDDOH began directly disseminating these forecasts to the public, and continues to issue them weekly during peak season so that the public can understand their risk of mosquito exposure.
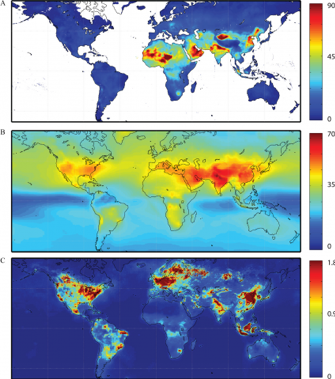
Going Global:
NASA’s satellites and ground monitors, equipped with remote-sensing devices, are used around the world to help assess air quality standards and potential impact on human health risks. Air pollution from ground-level ozone and fine particulate matter leads to an estimated 33 million visits to the emergency room for asthma worldwide. In collaboration with NASA’s Health and Air Quality Applications area, scientists have analyzed data from the Moderate Resolution Imaging Spectroradiometer (MODIS)sensor aboard NASA’s Terra and Aqua satellites to estimate global levels of pollution. These findings can inform efforts to ease the global burden of asthma, particularly where data were previously unavailable.
Coast-to-coast and pole-to-pole, NASA resources, tools, and information are empowering community members to learn about their ecosystem and take precautions to protect their health. During this National Public Health Week 2019, we are excited to share a few projects and partnerships that use Earth observing data in air quality management and public health. Through these transdisciplinary projects, we can learn more about health threats to humans, animals, and the environment, and seek future partnerships that develop solutions to mitigate these risks.