Christopher Hain of NASA’s Marshall Space Flight Center in Huntsville, Alabama, has released a new global geospatial dataset to benefit agriculture and food security around the world. The new dataset, called the Evaporative Stress Index (ESI), is available online and produced weekly at 5-kilometer resolution for the entire globe.
Millions of people in the developing world depend on agriculture for their livelihoods. However, uncertainties in weather patterns and water availability pose a serious challenge to reliable crop production. Hain’s ESI reveals the regions of drought where vegetation is stressed due to lack of water, enabling agriculture ministries to provide actionable advice to farmers about irrigation.
The ESI can capture early signals of “flash drought,” a condition brought on by extended periods of hot, dry, and windy conditions leading to rapid soil moisture depletion. Reduced rates of water loss can be observed through the use of land surface temperature before they can be observed through decreases in vegetation health or “greenness.” For example, a flash drought developed across the Upper Midwest during the spring and early summer of 2017. A new drought indicator called QuickDRI, developed by the National Drought Mitigation Center with ESI as a key input, was used by the United States Drought Monitor to provide timely updates of the rapidly changing conditions on the ground over the flash drought region.
“Importantly, the ESI describes soil moisture across the landscape without using observed rainfall data,” explains Hain. “This is critical in developing regions and other parts of the world lacking sufficient ground-based observations of rainfall.”
Scientists for the Group on Earth Observations Global Agricultural Monitoring (GEOGLAM) Crop Monitor for the Agricultural Market Information System (AMIS) have been experimenting with the global ESI product for over a year in support of agricultural ministries around the world. The Crop Monitor reports provide monthly maps and summaries of crop conditions -- by crop type -- within the main agricultural regions of the AMIS countries (G20+7).
“We have integrated the global ESI product into our monthly evaluations of crop conditions for our crop monitor bulletins,” says GEOGLAM’s Brian Barker of the University of Maryland. “As a way of detecting early signs of plant stress due to reductions in soil moisture, we have found that the global ESI product is an invaluable resource appropriate for timely, in-season agriculture monitoring.
The International Center for Biosaline Agriculture’s Middle East and North Africa (MENA) Regional Drought Management System is using global ESI as an input to a regional Composite Drought Index over the MENA region. In addition, the US Department of Agriculture Foreign Agricultural Service stressed that they will be integrating the global ESI dataset this year in a test mode.
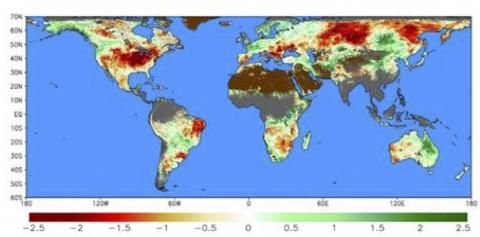
The ESI is based on satellite observations of land surface temperature, which are used to estimate water loss due to evapotranspiration (ET) -- the loss of water via evaporation from soil and plant surfaces and via transpiration through plant leaves. Generally, healthy green vegetation with access to an adequate supply of water warms at a much slower rate than does dry and/or stressed vegetation. Based on variations in land surface temperature, the ESI indicates how the current rate of ET compares to normal conditions. Negative ESI values show below normal ET rates, indicating vegetation that is stressed due to inadequate soil moisture.
ESI over the United States has been available for several years, but a recently funded project by NASA’s Applied Sciences Water Resources program has supported the development of the global ESI dataset. The global ESI data is available for analysis and download through SERVIR, a joint initiative of NASA and USAID.