As many as 300,000 people watch the top IndyCar racers burn rubber as the first weekend of summer kicks off in Indianapolis. But the race track isn’t the only thing that gets hot in the state capital. The number of summer days recording extreme heat are increasing, which is a concern to climate scientists tracking these temperatures to understand what the trend means to Indianapolis and its residents. NASA Earth Applied Sciences and Indiana University-Purdue University Indianapolis identified areas of Indianapolis that will be most affected by extreme heat and how to best warn residents.

“The initial projections are showing that the mid-latitudes and polar latitudes are the ones that are warming more significantly than the rest of the globe. And the Midwest – Indiana – falls right into that corridor of the mid-latitudes,” said Dan Johnson, a professor at Indiana University-Purdue University at Indianapolis (IUPUI). “We can project out to the next 100 years that we are going to experience many more heatwaves … only of more intensity and of longer duration.”
Johnson emphasized that if Indianapolis is ill-prepared for those heat events, it could be a disaster waiting to happen. “We could see a catastrophic event maybe on the nature of what we saw in Chicago in 1995, where we had over 700 deaths,” he said.
That dire possibility inspired NASA and IUPUI to collaborate on a more effective way to determine the specific locations of the hottest areas and most vulnerable populations around metropolitan Indianapolis. More important than creating a map, however, the project team wanted agencies and officials to be able to use that information to better warn people in affected areas and reduce the danger from exposure to excessive heat.
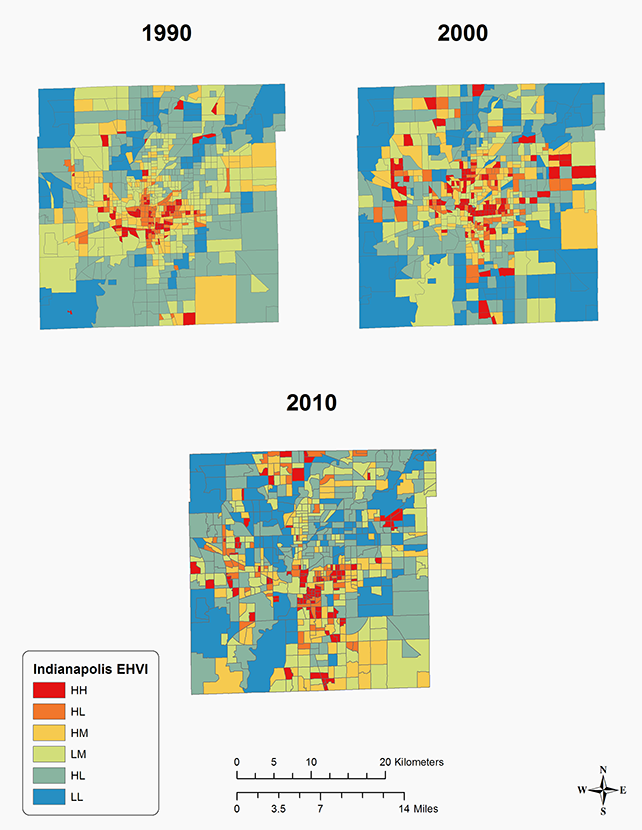
With Johnson as principal investigator, the team integrated imagery from Earth-observing satellites with the socioeconomic data of metropolitan Indianapolis to create the Extreme Heat Vulnerability Index (EHVI). The EHVI model blends environmental data with population variables, such as economic structure and heat-related mortalities. With this, officials can determine urban “hot spots” where residents would most likely face the highest risk for extreme heat-related health problems.
“[The EHVI can] help the emergency management agencies identify where are areas to go during these events, where to keep the ambulance close by, or where to take one of the city buses to a specific neighborhood and let some of the people get on and cool down in the air conditioning,” Johnson added. “Such targeted responses would prove to be more effective and efficient than draping a net of resources blindly over an entire city.”
“[The EHVI can] help the emergency management agencies identify where are areas to go during these events, where to keep the ambulance close by, or where to take one of the city buses to a specific neighborhood and let some of the people get on and cool down in the air conditioning.”
–Dan Johnson, Indiana University-Purdue University at Indianapolis
The EHVI project data also provide vital information for a longtime partner of IUPUI – the nonprofit environmental organization Keep Indianapolis Beautiful, Inc. (KIB). David Forsell, the president of KIB, detailed some of its history.
“KIB began working in earnest with IUPUI’s Geography Department in 2006,” he said. “KIB had an interest in applying research it had become aware of related to the social and ecological benefits of urban trees and green space.”
During this partnership, KIB and IUPUI developed a “hot spot” map that located approximately nine environmentally and socially vulnerable areas in the urban core of Indianapolis to help guide KIB’s tree-planting strategies.
In 2015, KIB secured funding to enable the static “hot spot” map to become a live, public, cloud-based tool. “KIB uses the map primarily for internal planning for tree planting, but it also is informing our decisions regarding equity and inclusion for future activities,” Forsell said. “Multiple variables are integrated in the map, including NASA data of impervious surfaces, plantable spaces, canopy cover, and social conditions, such as vulnerable populations.”
As Indianapolis heats up, this new space-based data will be a critical piece of KIB’s mission to keep things cool.