Imagen
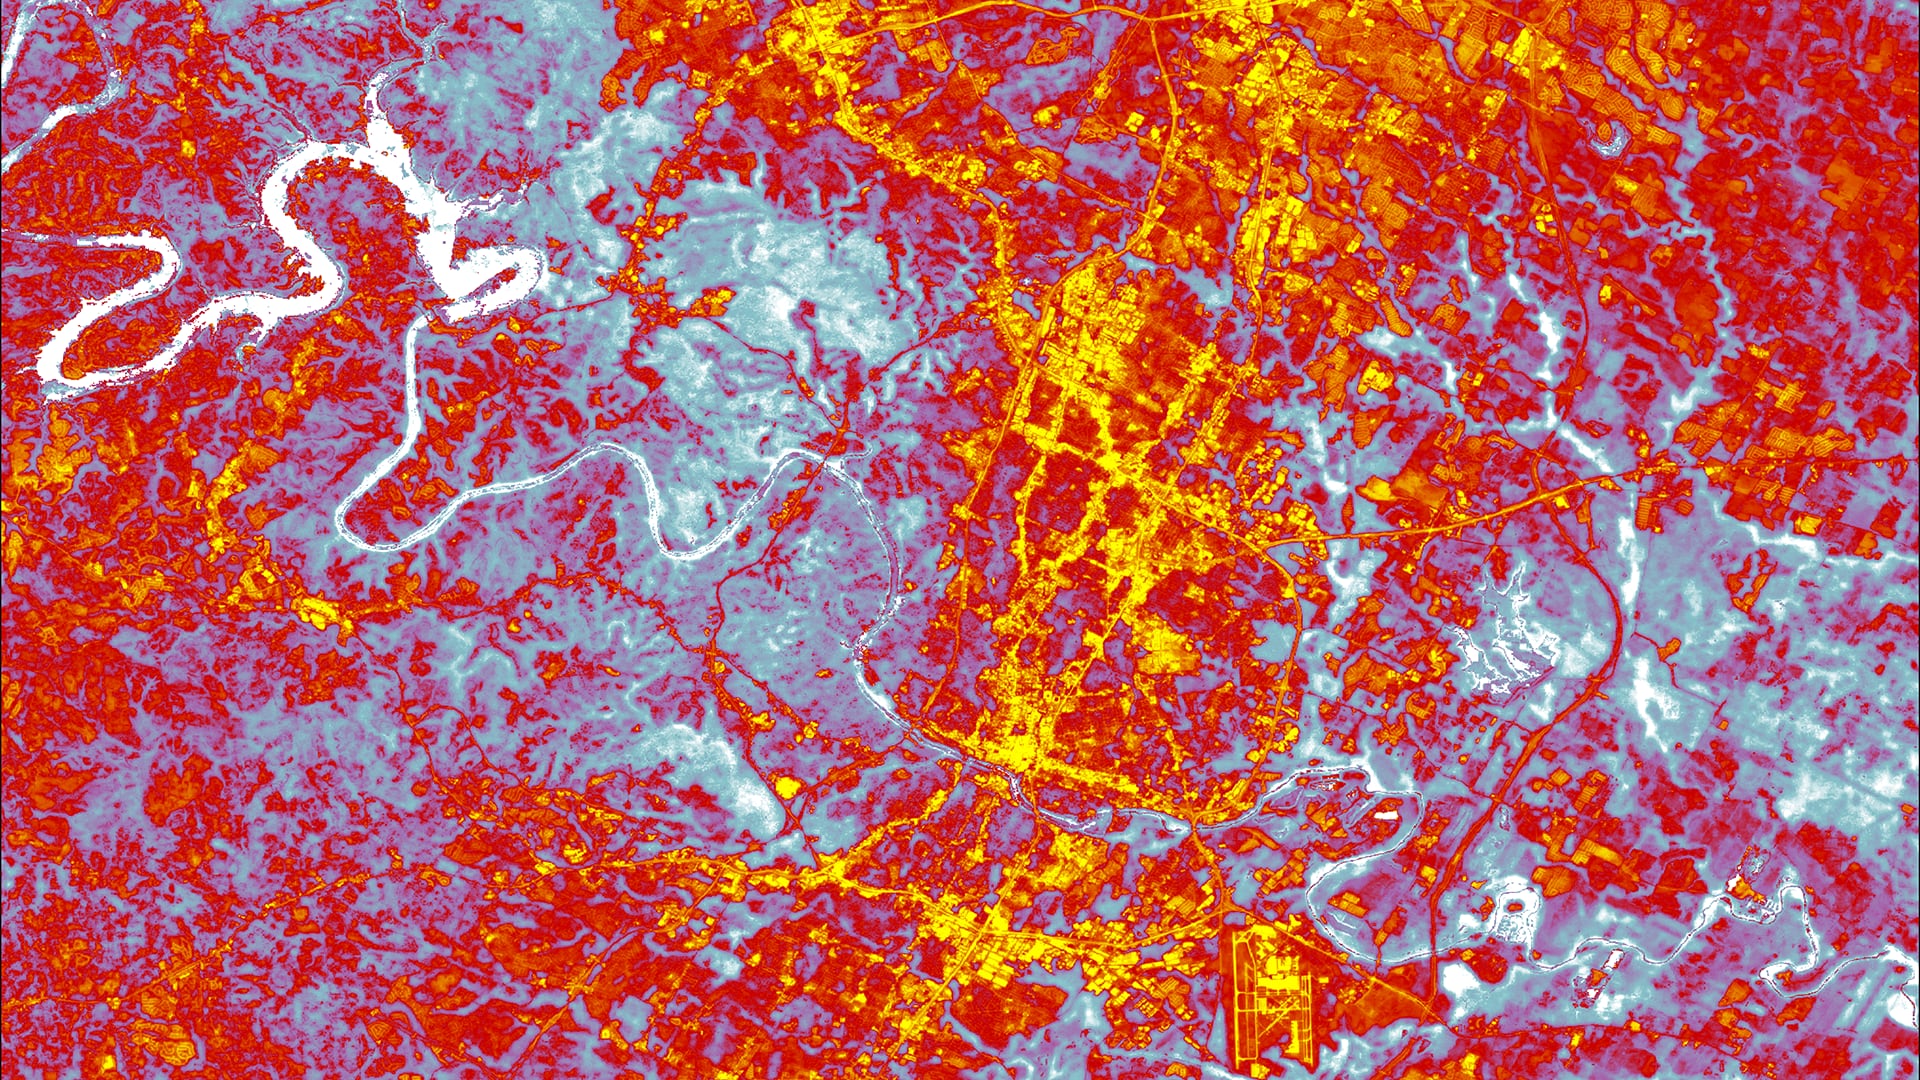
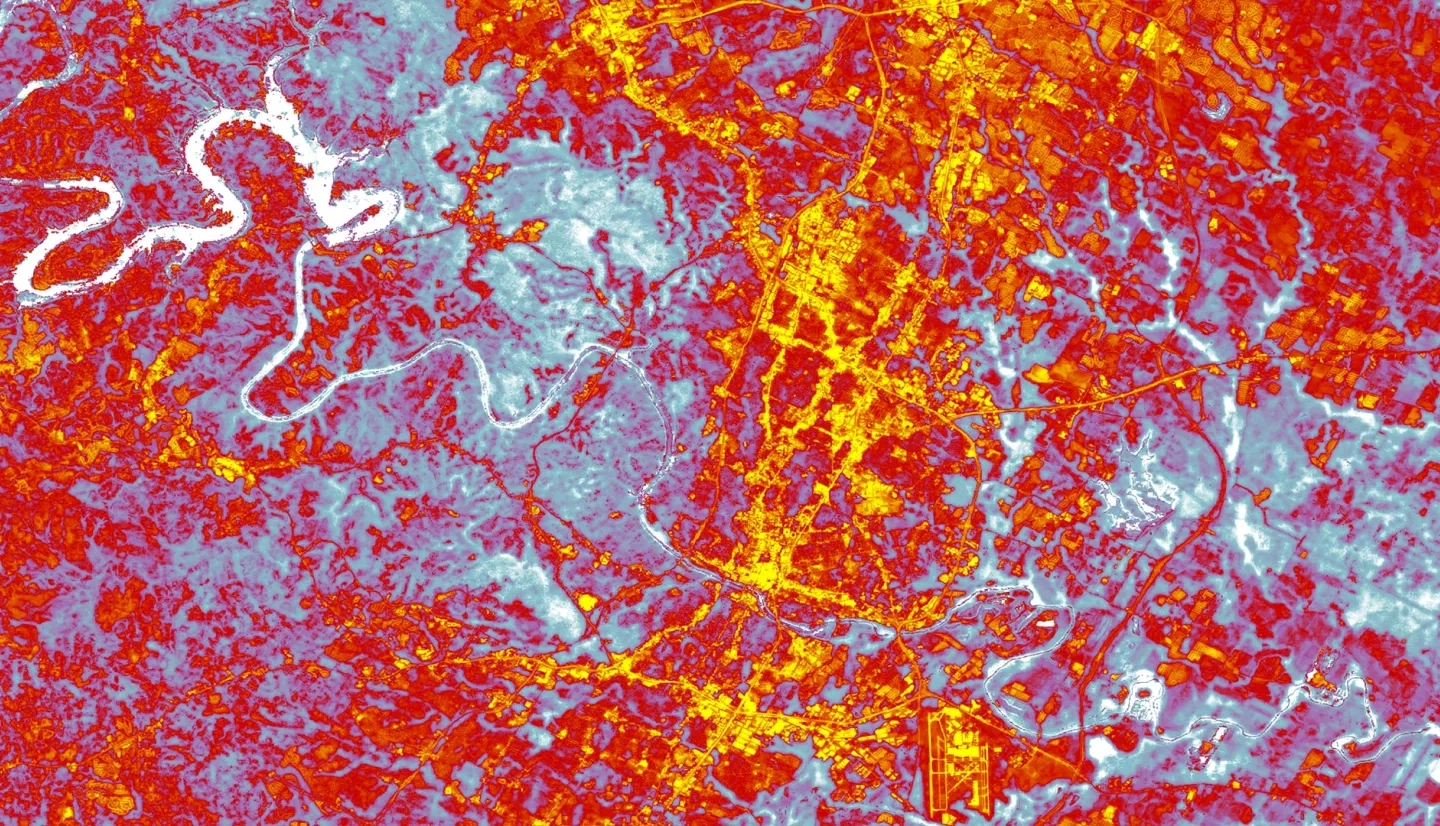
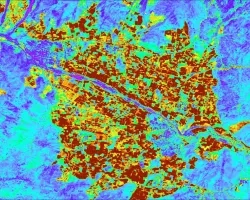
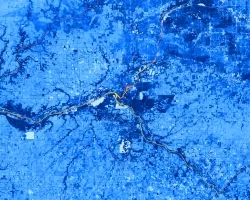
In recent years, Austin, Texas has experienced an increase in population and urban development. Additionally, the City’s climate continues to change and currently faces extreme heat and drought. As temperatures and demand for utilities and resources rise, the number of heat-related deaths and illnesses in socially vulnerable populations (e.g., older or lower-income populations) are expected to increase. The City of Austin, The University of Texas at Austin (UT Austin), and The University of Texas Health Science Center at Houston (UT Health) partnered with NASA DEVELOP to examine the distribution of urban heat throughout the City. This project utilized land surface temperature, greenness, plant water content, and urban surface material analysis parameters derived from NASA Earth observations from Landsat 8 Operational Land Imager (OLI), Landsat 8 Thermal Infrared Sensor (TIRS), and Aqua Moderate Resolution Imaging Spectroradiometer (MODIS). The DEVELOP team created a sharable geodatabase mapping heat exposure severity, areas of high social vulnerability, and an overall heat priority score. This overall score was determined with a weighted analysis of heat-related observations and socioeconomic data. The team tested the sensitivity of this score to a wide range of parameter decisions, such as which social variables were included. This heat priority index can be used to make informed infrastructure improvement plans in targeted areas (e.g., siting of cooling centers) and ensure equitable sustainable development.