Summary
Date: Sept. 19, 2021
Type: Volcanoes
Region: Africa, Canary Islands
Info & Resources:
- View maps & data products for the La Palma eruption on the NASA Disasters Mapping Portal
- NASA Disasters program resources for volcanoes
- Latest updates from the Instituto Geologico y Minero de Espana (IGME)
- Latest updates from the Smithsonian Global Volcanism Program
- Latest updates from the Instituto Volcanológico de Canarias (INVOLCAN)
- Educational story map of La Palma data products & visualizations, developed by Esri
UPDATE Oct. 13, 2021
View fullscreen on the NASA Disasters Mapping Portal
Researchers working with the NASA ROSES A.37 project “Day-Night Monitoring of Volcanic SO2 and Ash for Aviation Avoidance at Northern Polar Latitudes” developed this animation of sulfur dioxide (SO2) clouds from the La Palma eruption using satellite data from NASA / NOAA Suomi-NPP and NOAA-20 Ozone Mapping and Profiler Suite (OMPS) spectrometers. Both satellites fly similar near-polar orbits, but are about 50 minutes apart. NOAA-20 OMPS measures with higher ground resolution. Using two satellites allows researchers to make more frequent, precise observations to identify hazardous densities of volcanic gases and aerosols.
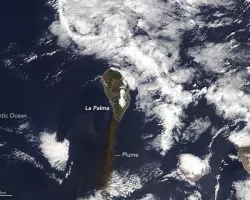
The above animation shows SO2 column density in Dobson Units (1 DU = 2.69 x 10¹⁶ SO2 molecules /cm2) from Sept. 19 – 30, 2021. S02 is used to indicate the presence of volcanic gases and also as a proxy for volcanic aerosols (sulfuric acid or vog and ash), which can negatively affect air quality for people living in the region, as well as potentially damage aircraft flying through the volcanic clouds. Credits: NASA
Update Oct. 4, 2021
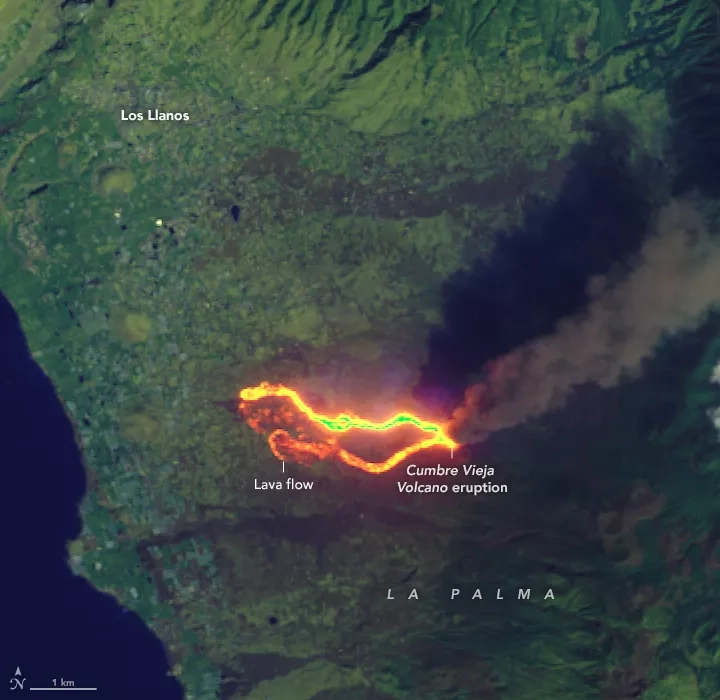
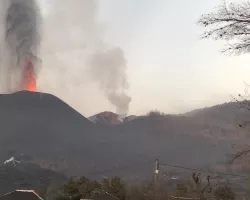
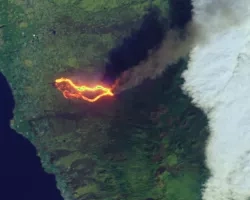
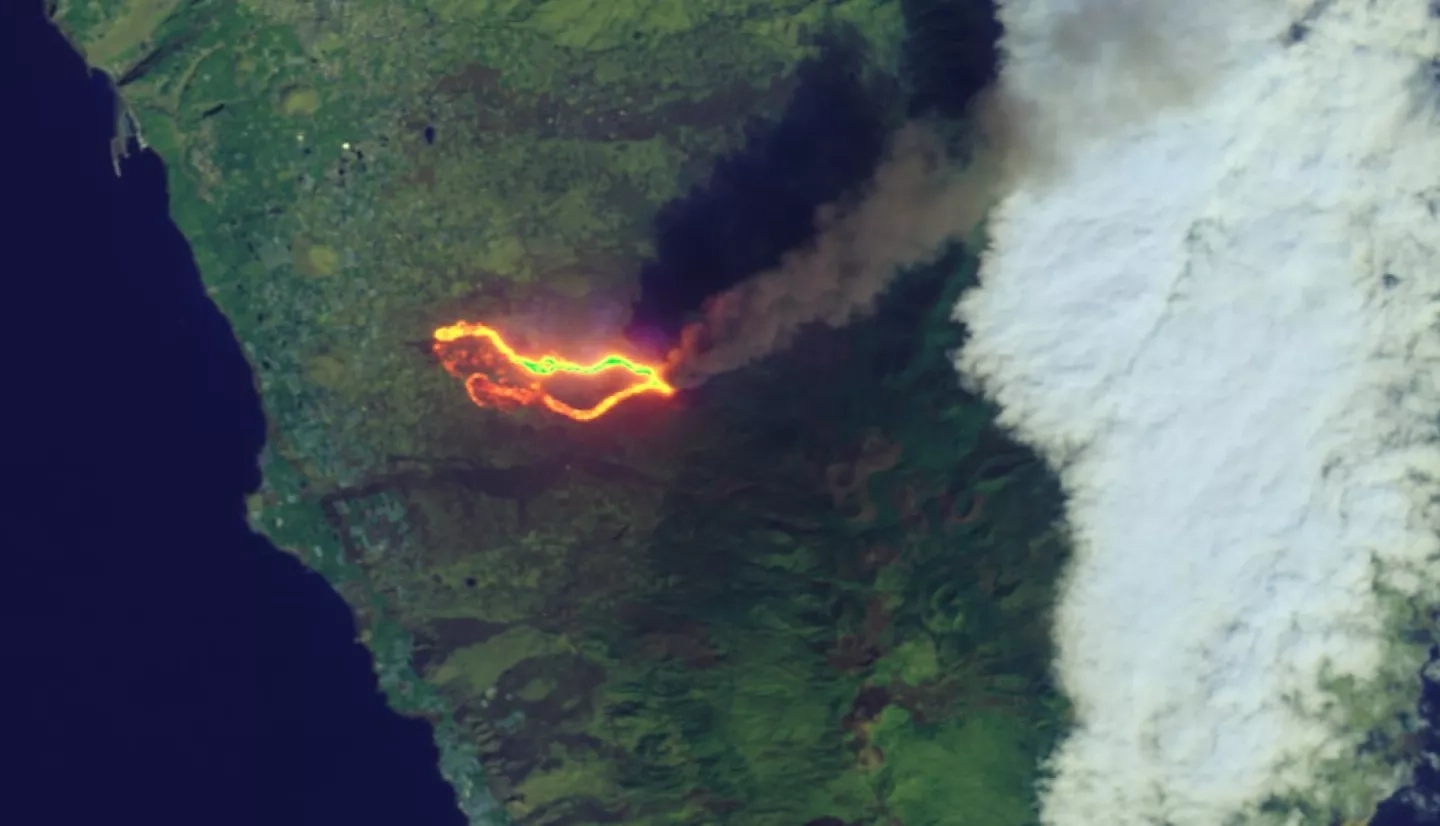
On Sept. 19, 2021, the Cumbre Vieja volcano on the island of La Palma in the Canary Islands started erupting after remaining dormant for 50 years. Since the initial eruption, the volcano has seen several Strombolian explosions, significant emissions of ash and gas, and multiple vents spewing molten lava down the mountain and into surrounding regions. According to the latest media reports over 800 buildings have been destroyed and about 6,000 people evacuated from the area.
The NASA Earth Applied Sciences Disasters program area has activated efforts to monitor the eruption and provide Earth-observing data and analysis in support of risk reduction and recovery for the eruption. The program is in contact with colleagues from the Instituto Geologico y Minero de Espana (IGME) and the Institut de Physique du Globe de Paris (IPGP) to share knowledge and data for situational awareness.
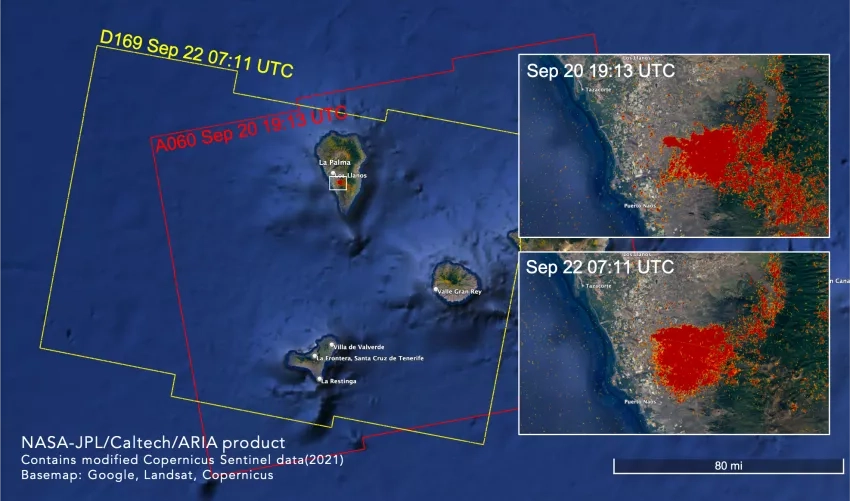
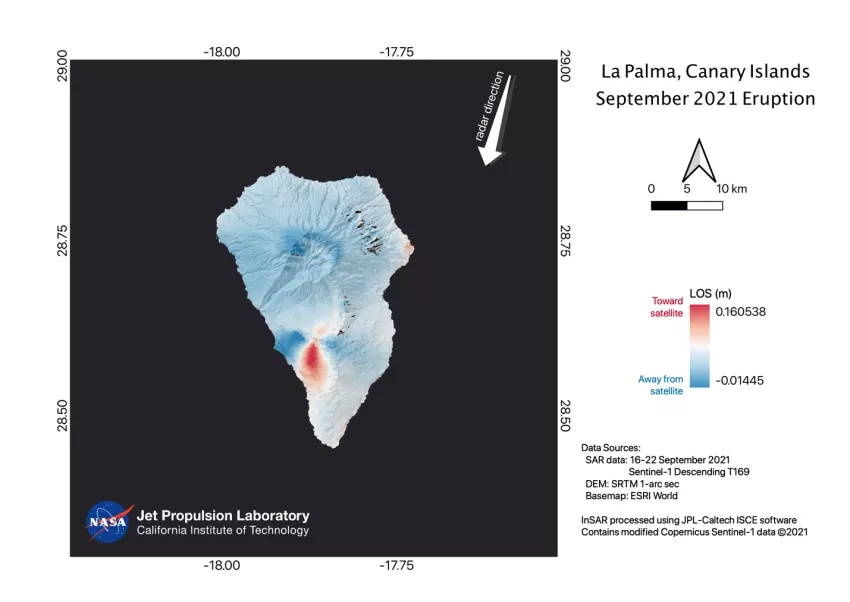
These efforts are being supported by the NASA ROSES A.37 research projects “Day-Night Monitoring of Volcanic SO2 and Ash for Aviation Avoidance at Northern Polar Latitudes” and “Global Rapid Damage Mapping System with Spaceborne SAR Data.”
Related Impact