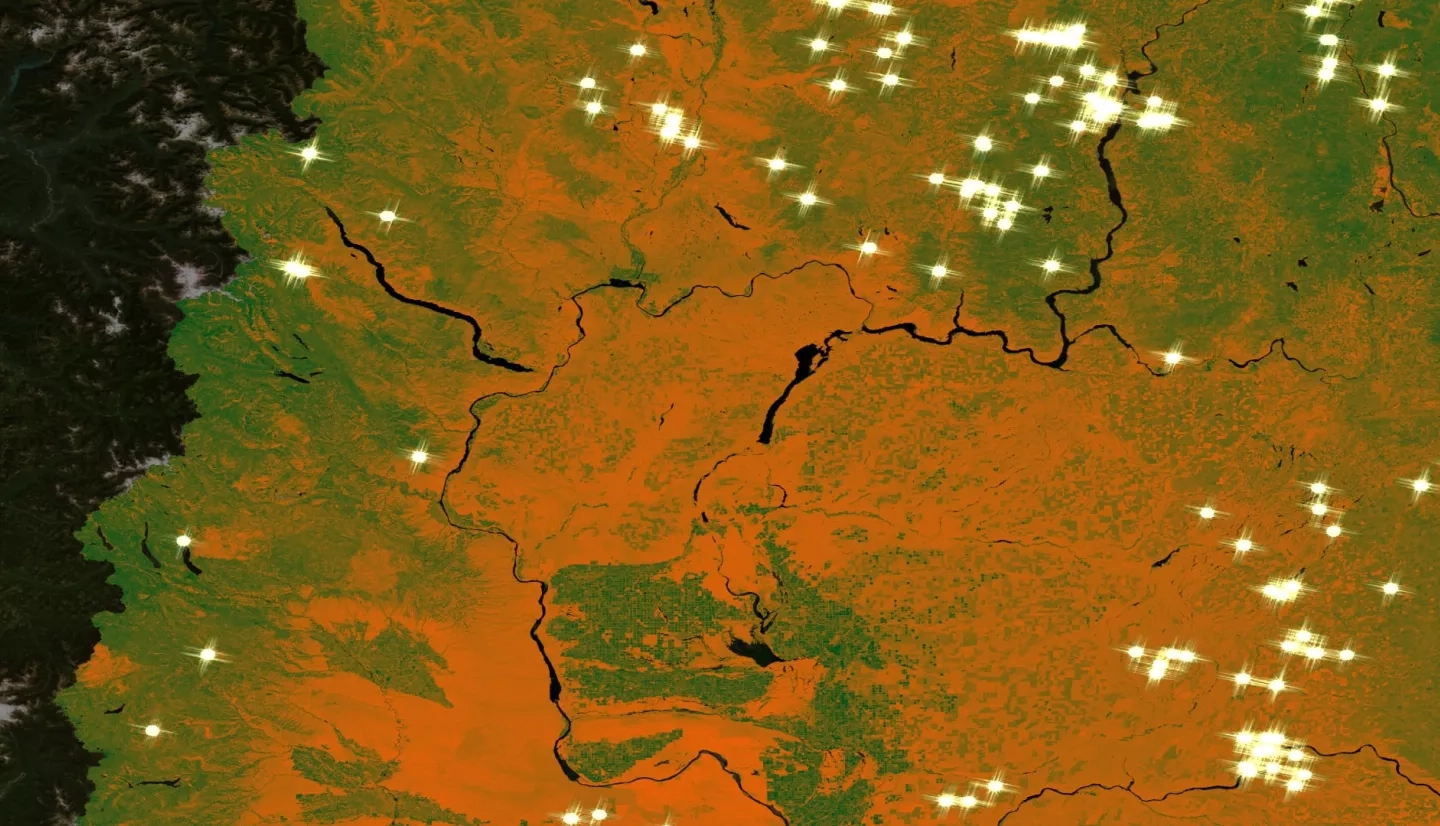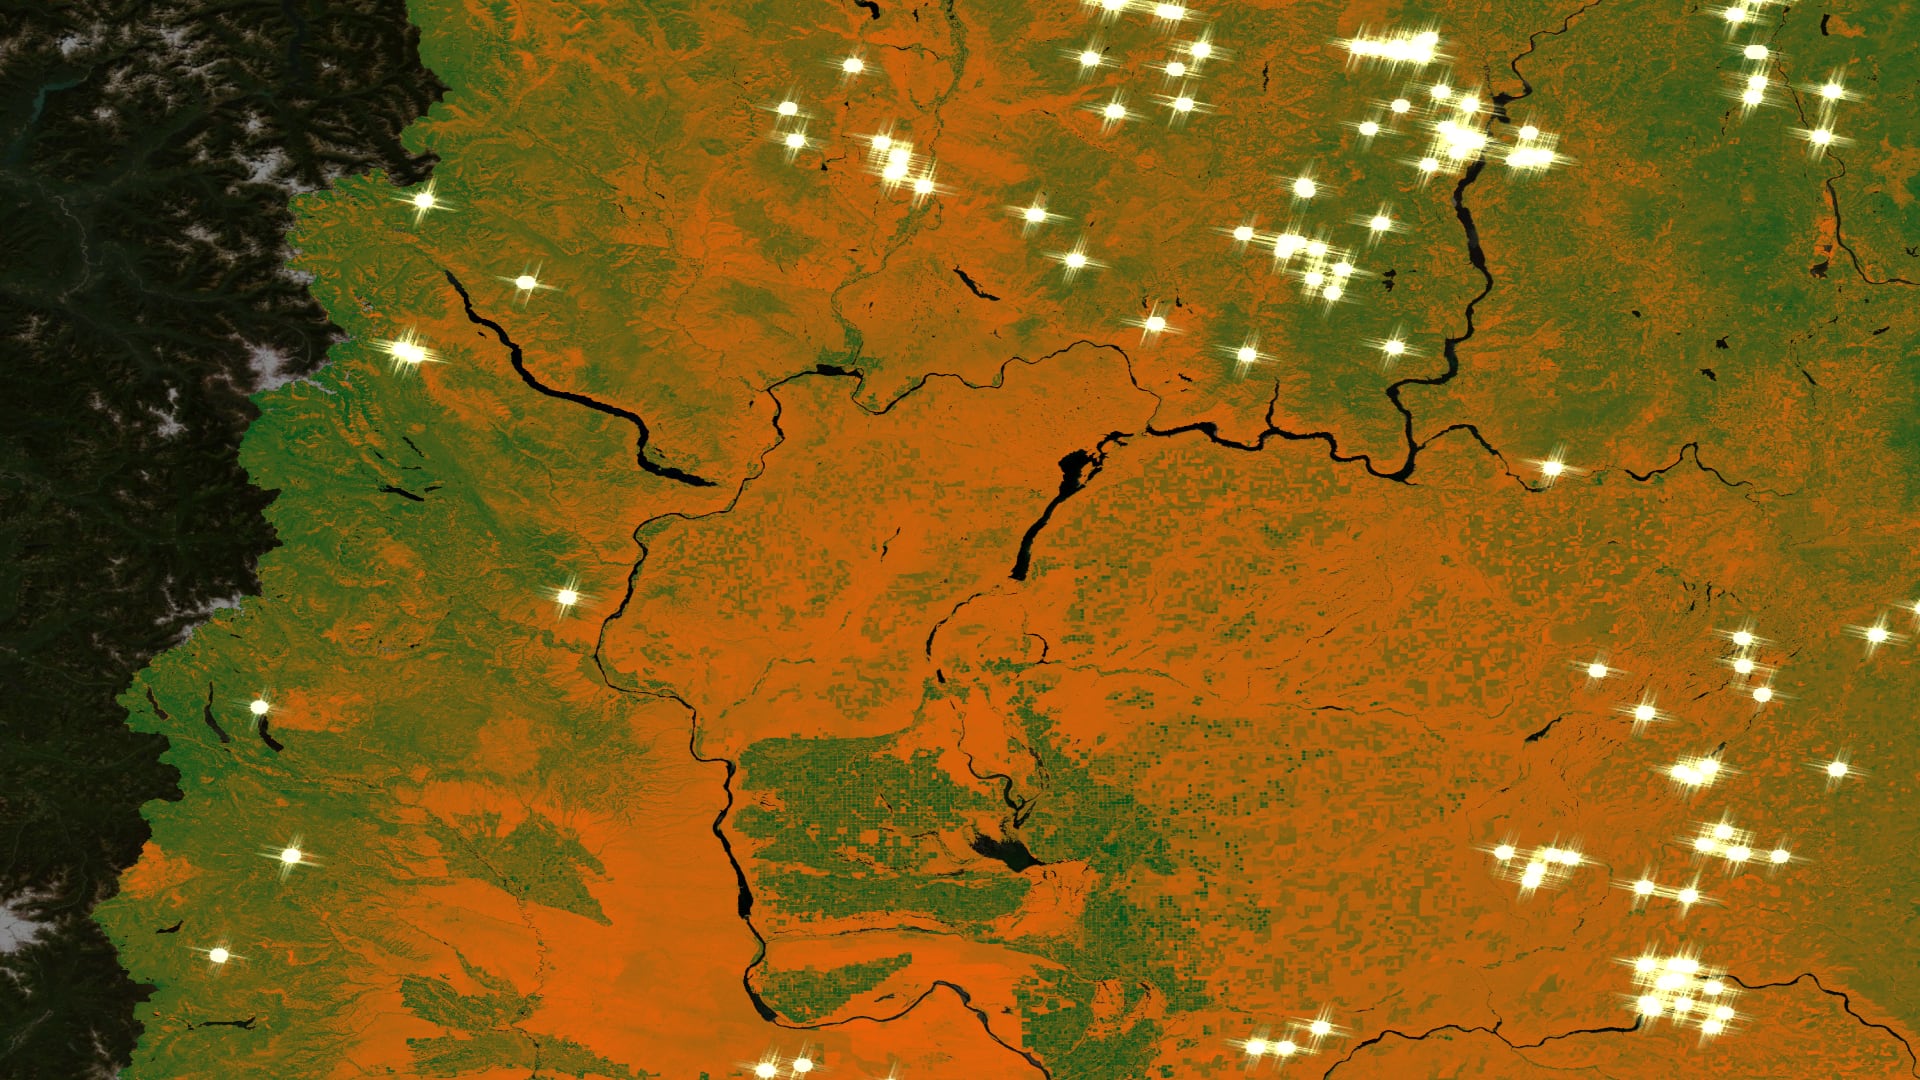
According to the Washington Department of Natural Resources, roughly 36% of large fires in the state since 2010 were caused by lightning. General trends also show a greater increase in the number of lightning-ignited fires over the last three decades. The NASA DEVELOP Eastern Washington Disasters team partnered with The Nature Conservancy’s Washington Chapter to analyze the relationship between lightning strikes and wildfire events in Eastern Washington, with an emphasis on Kittitas and Yakima Counties. Using the International Space Station Lightning Imaging Sensor, the Landsat 5 Thematic Mapper and Landsat 8 Operational Land Imager vegetation moisture index, and Washington Department of Natural Resources historical fire data, the team generated a lightning-caused fire vulnerability index for 2001-2019. Climatology maps of lightning, wildfire, and vegetation moisture of the study area, along with an Esri ArcGIS StoryMap, further communicated project findings. Results demonstrated spatiotemporal patterns of lightning-ignited wildfires in Eastern Washington to inform land management practices and better predict areas that may be more vulnerable to these events.
