Description
September 28, 2018 - October 05, 2018
Land cover changes can impact many areas of life. These changes can affect deforestation, ecological communities, wildfire extent, and urban growth. This advanced series focuses on using satellite imagery to map changes in land cover. Attendees will learn change detection methods, including image subtraction and classification. They will also conduct their own change detection analysis. This training will use QGIS, the R statistical program, and the Random Forest algorithm. Both sessions will featured a lecture and hands-on exercises.
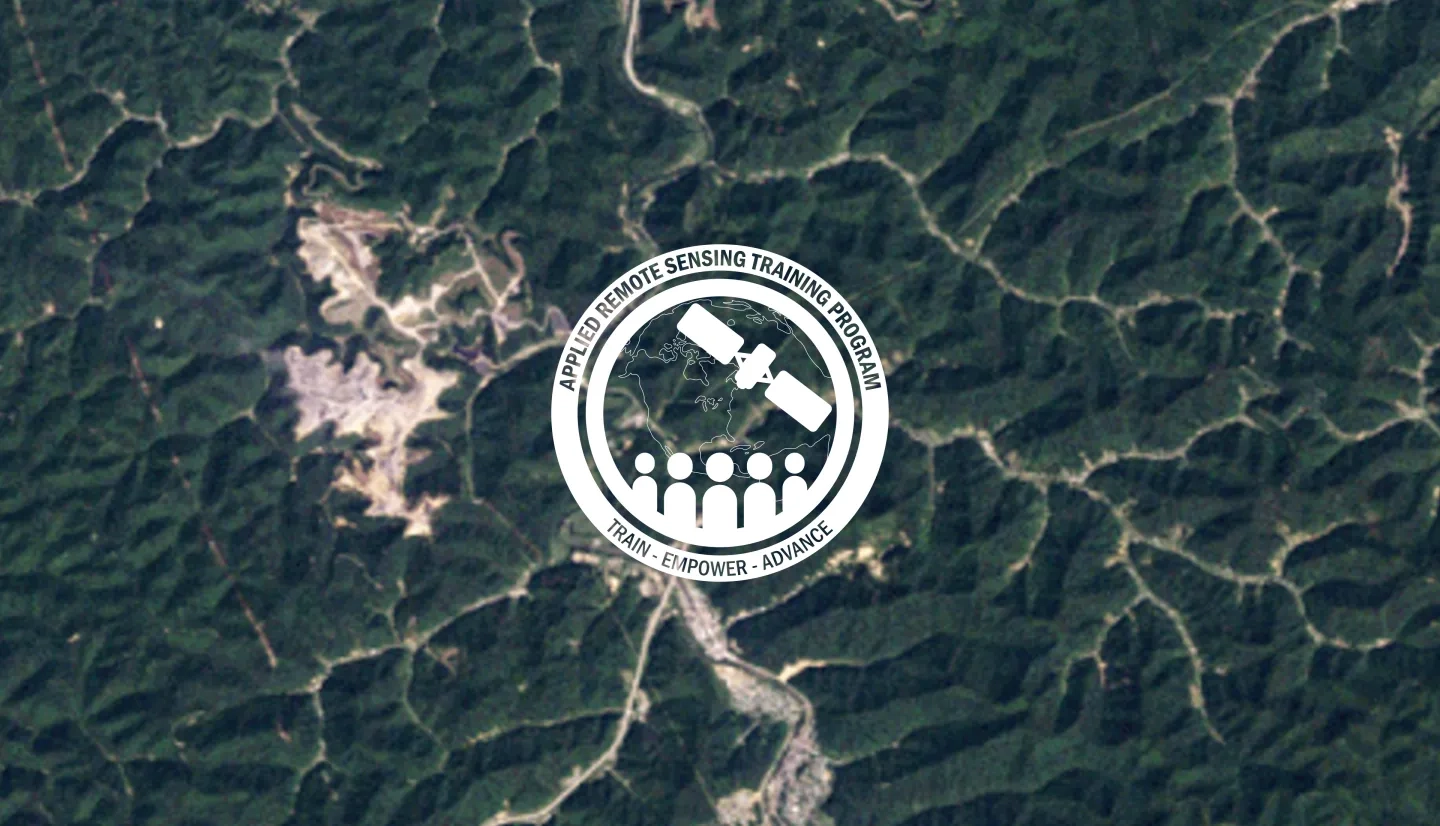
Read more about the image above at NASA Earth Observatory.
- Complete Sessions 1 & 2A of Fundamentals of Remote Sensing, or equivalent experience
- View Advanced Webinar: Land Cover Classification with Satellite Imagery
- View Advanced Webinar: Accuracy Assessment of a Land Cover Classification
- Download and install QGIS and all accompanying software.
- View QGIS Download Instructions for more information on installing QGIS
- This advanced training will use QGIS software, and although previous experience with this software is not required, some experience with geospatial software will be helpful. We strongly recommend you open QGIS and ensure the software is working prior to starting the webinar.
- This training will use QGIS 3. If you are using MacOS, please be sure you have the correct version of Python and QGIS installed, and that you have followed the instructions in the document above to fix a known file path issue
- Download and install the R statistical program – http://www.r-project.org/ - an open source statistical program that will be used for the classification algorithm called Random Forest, a type of decision tree classifier.
- Download and install R studio – http://www.rstudio.com/ide/download/
- Freely available graphical user interface which, although not required for the methodology, it will provide a more user-friendly interface for running the R statistical program, especially for users unfamiliar with R.
- Become familiar with Landsat bands and color combinations
- Understand how to visualize change in land cover using Landsat data
- Learn the basic steps for change detection by:
- Conducting image subtraction between two dates using QGIS
- Creating multi-date Landsat layer stacks
- Conducting multi-date land cover classification using the Random Forest classification in R
- Identifying and analyzing changes in land cover
Local, regional, state, federal, and international organizations interested in assessing vegetation conditions and analyzing land cover changes using satellite imagery.
- Two 2-hour sessions
This session will focus on an introduction to change detection. Included will be an overview of change detection, how to visualize change, and how to analyze land cover change using the image subtraction method.
Materials:
Materiales en Español:
This session will continue with conducting a change detection analysis and will include analyzing land cover change using different classification methods.
Materials:
Materiales en Español:


