As record-setting fires continue to ravage the western United States, with large fire complexes currently burning in California, Oregon, Washington State, and Colorado, coordinators and scientists from the NASA Earth Applied Sciences Disasters Program are hard at work developing maps, imagery and analysis to aid local agencies and response teams in understanding the impacts from the fires and the potential risks to people, infrastructure, and the environment.
In late August the Disasters Program activated coordination efforts in response to the fires in California, and since then has been working closely with local stakeholders including the California National Guard, the California Geological Survey, the Federal Emergency Management Agency (FEMA), the California State Geographic Information Officer, the California Office of Emergency Services (CalOES), and the California Department of Forestry and Fire Protection (CalFire). As fires began to burn in Oregon, Washington State, and Colorado the Program started working with stakeholders in those regions, including the Washington State Emergency Management Division, the Olympic Region Clean Air Agency, the Washington State Department of Natural Resources, the Washington Department of Ecology, and the Colorado Department of Public Safety. The Disasters Program is also reaching out to emergency management agencies in Oregon, and has recently began discussions with the U.S. Army Corps of Engineers (USACE). Support is being provided directly to these users through emails and virtual meetings, and through data products digitally distributed on the NASA Disasters Mapping Portal.
View fullscreen on the NASA Disasters Mapping Portal
In addition to regularly generated near real-time fire products such as Global Fire Emissions Database (GFED) aerosol amounts, Fire Information for Resource Management System (FIRMS) Active Fire Points, Ozone Mapping and Profiler Suite (OMPS) Aerosol Index, and Land Information System (LIS) Relative Soil Moisture and Evaporative Stress Index, the Mapping Portal is being used to distribute event-specific products generated through ROSES A.37 research projects and partner programs within NASA. For example, the NASA Disasters Geographic Information Systems (GIS) Team produced the first ever 3D interactive map of Cloud-Aerosol Lidar with Orthogonal Polarization (CALIOP) data showing the vertical distribution of wildfire smoke. Other Mapping Portal products supporting the western U.S. fires include 2D and 3D Multi-Angle Imaging Spectroradiometer (MISR) plume data, a regularly-updated map of MODIS Aerosol Optical Density organized by California Air Basins for air quality concerns, and a map displaying fire proximity to residential areas and critical infrastructure using Moderate Resolution Imaging Spectroradiometer (MODIS) and Visible Infrared Imaging Radiometer Suite (VIIRS) Fire Points data provided through the ROSES A.37 project “Open Critical Infrastructure Exposure for Disaster Forecasting, Mitigation and Response.”

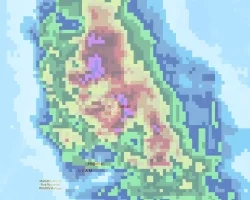
As part of the activation the Disasters Program formed an Air Quality and Fire Propagation sub-group to focus on those two topics. The group is working directly with the NASA Health and Air Quality Applied Sciences Team (HAQAST) and is providing air quality and smoke plume analysis using data from the CALIOP and MISR instruments to the United States Forest Service (USFS). In addition, the ROSES A.37 research project “Coupled Interactive Forecasting of Weather, Fire Behavior, and Smoke Impact for Improved Wildland Fire Decision Making” is providing fire detection, smoke modeling, and fire propagation modeling datasets, including 1-hour, 10-hour, and 100-hour hour fuel moisture forecasts (shown above). The Program is also in touch with contacts at the California Air Resources Board and the Bay Area Air Quality Management District to inform them of the air-quality related products.

The MISR Active Aerosol Plume-height Project (AAP), funded through the NASA Earth Science Research and Analysis Program, is using data from NASA's Terra satellite to map the properties and near-source dispersion of smoke plumes from the fires. The AAP is also comparing data from MODIS, MISR, CALIPSO, and OMPS to conduct a more detailed analysis to thoroughly understand the characteristics of the smoke. Click here for further analysis from the AAP.

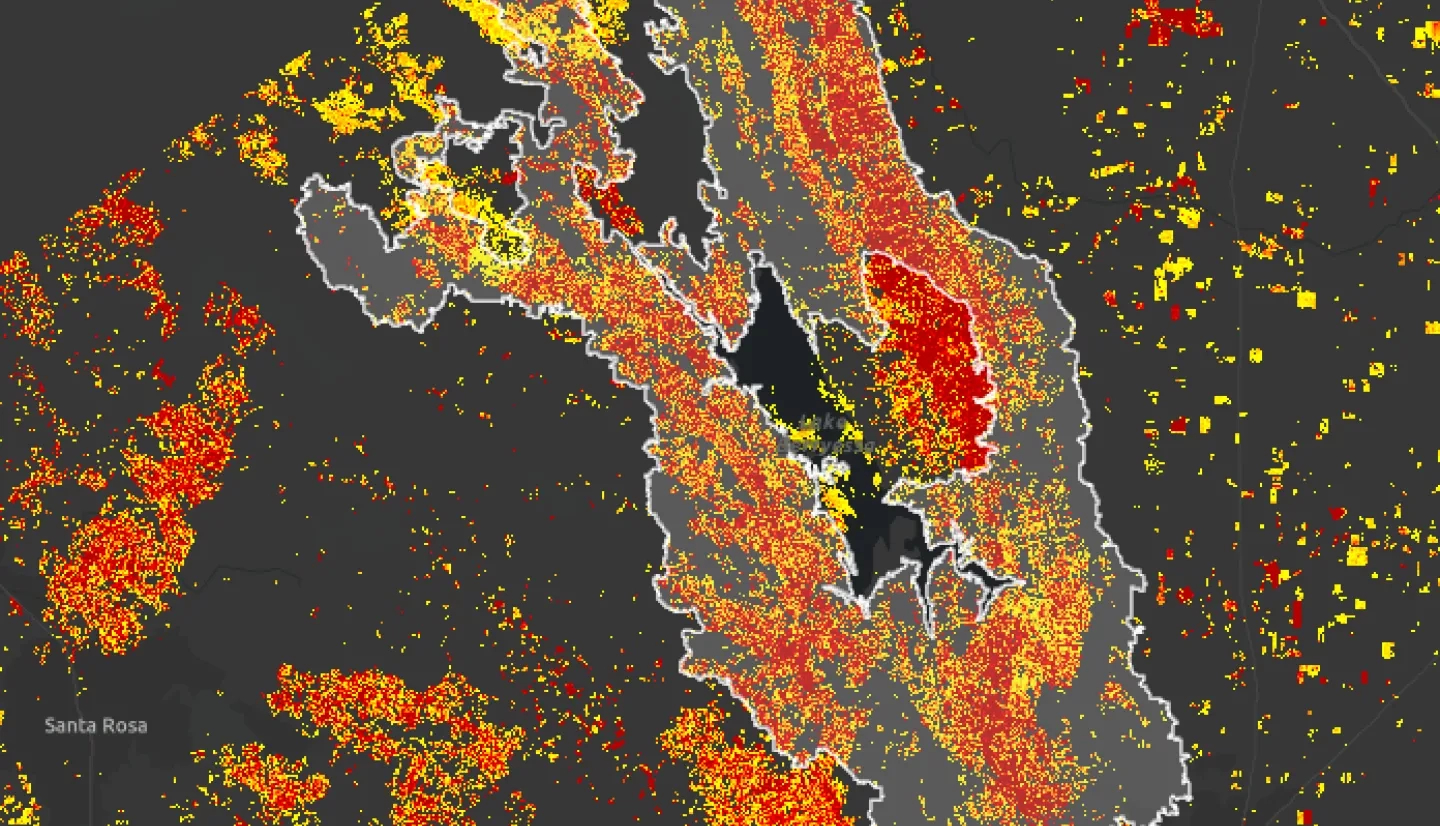
In addition to satellite-based data, the Program is also using NASA Airborne Science data from the Uninhabited Aerial Vehicle Synthetic Aperture Radar (UAVSAR) and Short-Wave Infrared (SWIR) instruments flying aboard a NASA Gulfstream C-20A jet. A first flight on September 3rd surveyed the LNU Lightning Complex burn area northeast of San Francisco, while an additional flight on September 9th focused on fires in Southern California. Data from these flights will be used for damage detection, burn scar mapping and hot spot detection. The ROSES A.37 project “Global Rapid Damage Mapping System with Spaceborne SAR Data” has provided Damage Proxy Maps (DPMs) for the LNU Lightning Complex from data acquired on the September 3rd flight to stakeholders to assist with situational awareness, and is in the process of generating DPM’s from the September 9th flight. Coordinators from the Disasters Program conducted a call with California stakeholders to update them on the status of these airborne products and explain the use of UAVSAR data. The California National Guard and the California Geological Survey have offered to provide validation of this data to help improve the products, and the U.S. Postal Service has reached out to request additional DPM’s to identify potential impacts to their distribution network. Learn more about the UAVSAR flights.
Advanced Spaceborne Thermal Emission and Reflection Radiometer (ASTER) data and MODIS data have been provided to stakeholders to assist in determining fire perimeters and burn scars for the River/Carmel Complex fires, the CZU Lightning Complex, and the LNU Complex. Disaster Coordinators at NASA’s Marshall Space Flight Center are also processing optical data from the Sentinel-2 and Landsat-8 satellites for higher-resolution burn scar and fire location detection.
The California Geological Survey has requested assistance in understanding the future potential for debris flow, flooding, rockfall, landslides, and erosion. The Disasters Program has reached out to partners across NASA as well as the operational authority, the USGS, to assist CGS in understanding the risks of those hazards caused by the fires.