In early April, the La Soufrière volcano on the island of Saint Vincent violently erupted - the first major eruption since 1979. In addition to sending volcanic ash and gas high into the atmosphere, the explosive eruptions blanketed much of the island in volcanic ash and rock, and triggered pyroclastic flows - dangerous and fast-moving avalanches of hot ash, gas and debris.
Researchers from the NASA Disasters program area, who have been monitoring the volcanic activity on Saint Vincent since January, used satellite data to observe impacts to the island and local communities that the eruptions unleashed. Using these data, the researchers identified areas where the volcanic ash and pyroclastic flows may have impacted local population centers. They also used the data to track potential damage to vegetation.
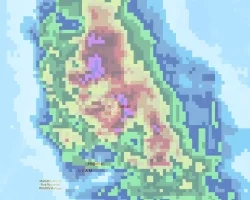
Comparison of a Damage Proxy Map, showing regions of likely ashfall on April 12, 2021, with population data from POPGRID. Credits: Earth Observatory of Singapore, NASA-JPL / Caltech / ARIA Project, Google, Landsat. POPGRID. Contains modified Copernicus Sentinel data (2021), processed by ESA.
The above interactive image slider allows you to compare a Damage Proxy Map (DPM) with population data. The DPM (swipe right), which was created by comparing pre- and post-eruption Synthetic Aperture Radar (SAR) data, identifies the likely extent of ashfall in urban areas. In the DPM, yellow indicates areas that were likely moderately affected by ashfall, while red indicates areas that were likely severely affected. When swiping left, you can see areas of population density, with warmer colors indicating that more people live in that region. Comparing the SAR data with the population data illustrates where falling ash, tephra (rock fragments), or pyroclastic flows may have posed a threat to local communities.
The data show that some communities located to the volcano’s southwest may have been the most impacted by pyroclastic density currents and ashfall. This DPM is most useful over urban and non-vegetated areas and is not as reliable over vegetated areas where false negatives may be expected. Due to these limitations, this DPM does not show ashfall or pyroclastic flow over vegetation.
Infrared satellite imagery of Saint Vincent from before (April 8) and after (April 13) the eruption from the ESA Sentinel-2A/2B satellites. Credits: NASA, Contains modified Copernicus Sentinel data (2021), processed by ESA.
Optical satellite instruments can allow researchers to detect damage to vegetation. The economy of Saint Vincent is highly dependent on agriculture, so damage to local farms and crops can have a devastating impact on the residents’ livelihoods. The above visualization uses false color compositing, a method that combines information from different infrared and visible bands to discern a particular feature. Assigning the bands to the red, green, and blue channels of the composite creates an image that uses specific color combinations to highlight the feature of interest.
Shown here are two different false color composites that include the near-infrared (NIR) channel, which is sensitive to the chlorophyll in vegetation. The top two images use the combination NIR with the red and green visible channels. This results in a composite image where healthy vegetation shows in the brighter reds, with some denser plant growth appearing in darker red. Urban areas tend towards cyan and gray while the clouds are white. Before the eruption, much of the island appears bright red in the image, indicating healthy vegetation. After the eruption, the island takes on a much darker gray appearance due to the fallen ash. One can also see large amounts of ash and smoke in the atmosphere in gray, in contrast to the white clouds.
The lower two images show a false-color composite using the shortwave infrared (SWIR), NIR, and the red visible channels. Although this combination is routinely used to identify water, the shortwave band is sensitive to burned land and is sometimes used to map soil. Again, taking advantage of the NIR, this combination depicts healthy vegetation in bright green while ash appears in the dark grays and black.
The differences in the pre- and post-eruption imagery appear to show significant ash on the northern half of the island, with potentially severe impacts to local vegetation and agriculture. Although only two images are shown here, using this type of image analysis over longer time periods may provide ancillary information on impacts to vegetation and local communities, especially when combined with ground surveys and local knowledge on where ash concentrations may be higher and potentially more hazardous.
(Left) A false-color composite of Synthetic Aperture Radar (SAR) data from the European Space Agency Sentinel-1 satellite on April 12, 2021. (Right) Population data from POPGRID. Credits: NASA , POPGRID. Contains modified Copernicus Sentinel data (2021), processed by ESA.
The technique of false color compositing is also useful for visualizing SAR data. Clouds do not hinder synthetic aperture radar instruments like they hamper optical and infrared instruments. Still, SAR imagery can be difficult to interpret given the unique way SAR “sees” the Earth’s surface. To help make these complex images easier to interpret, scientists use the same false-color composite techniques described above to highlight features of interest. In the above image, the normalized SAR images in pre- and post-eruption are combined in order to detect potential areas of pyroclastic flows (dark red) and volcanic ash and tephra (lighter red). NASA’s efforts to innovate methods of analyzing and visualizing SAR data provide many promising applications for understanding the impacts of disasters around the world, and help to build resilient communities that are better prepared to face the disasters of the future.
By using satellite data to observe the island before and after the eruption, researchers can get a more comprehensive view of how the eruption impacted local communities compared to ground-based observations. These data are critical to arming local governments and disaster response agencies with the tools they need to make informed decisions for response and recovery efforts.
NASA’s efforts to aid the people of La Soufriere were recognized by Michal Camejo-Harry, a Junior Research Fellow of volcanology at the Seismic Research Centre, who said, “On behalf of UWI-SRC, I would like to take the time to thank you all for supporting our monitoring activities at La Soufriere volcano, St. Vincent. Your willingness to provide complementary data and respond to our needs has been greatly appreciated.”
View other NASA updates and resources for the La Soufrière eruption.
View more La Soufrière data visualizations on the NASA Disasters Mapping Portal.