Severe weather often brings flooding that can devastate communities. Flood waters can damage homes and business, put lives at risk, and block key roadways for days at a time. Floods can also cause compounding impacts - triggering destructive landslides and causing extended power outages that hamper recovery.
NASA has developed a broad suite of tools that harness Earth observation data to assess flood impacts. These tools can help emergency managers understand flood hazards and their potential impacts to communities, homes, and infrastructure, guiding response and recovery efforts.
Below we share several key products from the NASA Disasters Mapping Portal that your team can harness to increase your flood awareness. These examples are from the NASA Disasters Response Coordination System (DRCS) activation for the severe weather that struck the southeast U.S. in April 2025. NASA DRCS shared these and other products with FEMA and the National Weather Service to aid their response efforts.
Each product shown is freely available through an ArcGIS REST-endpoint or WMS service, and automatically generated upon satellite acquisition, meaning you can integrate these into your flood monitoring workflows today. The NASA Disasters Response Coordination System can also generate custom products for response partners catered to their unique needs for a given disaster. We encourage emergency managers to reach out to drcs@nasa.gov to learn more about these capabilities and how NASA science and data can augment your organization’s disaster response needs.
HydroSAR Surface Water Extent

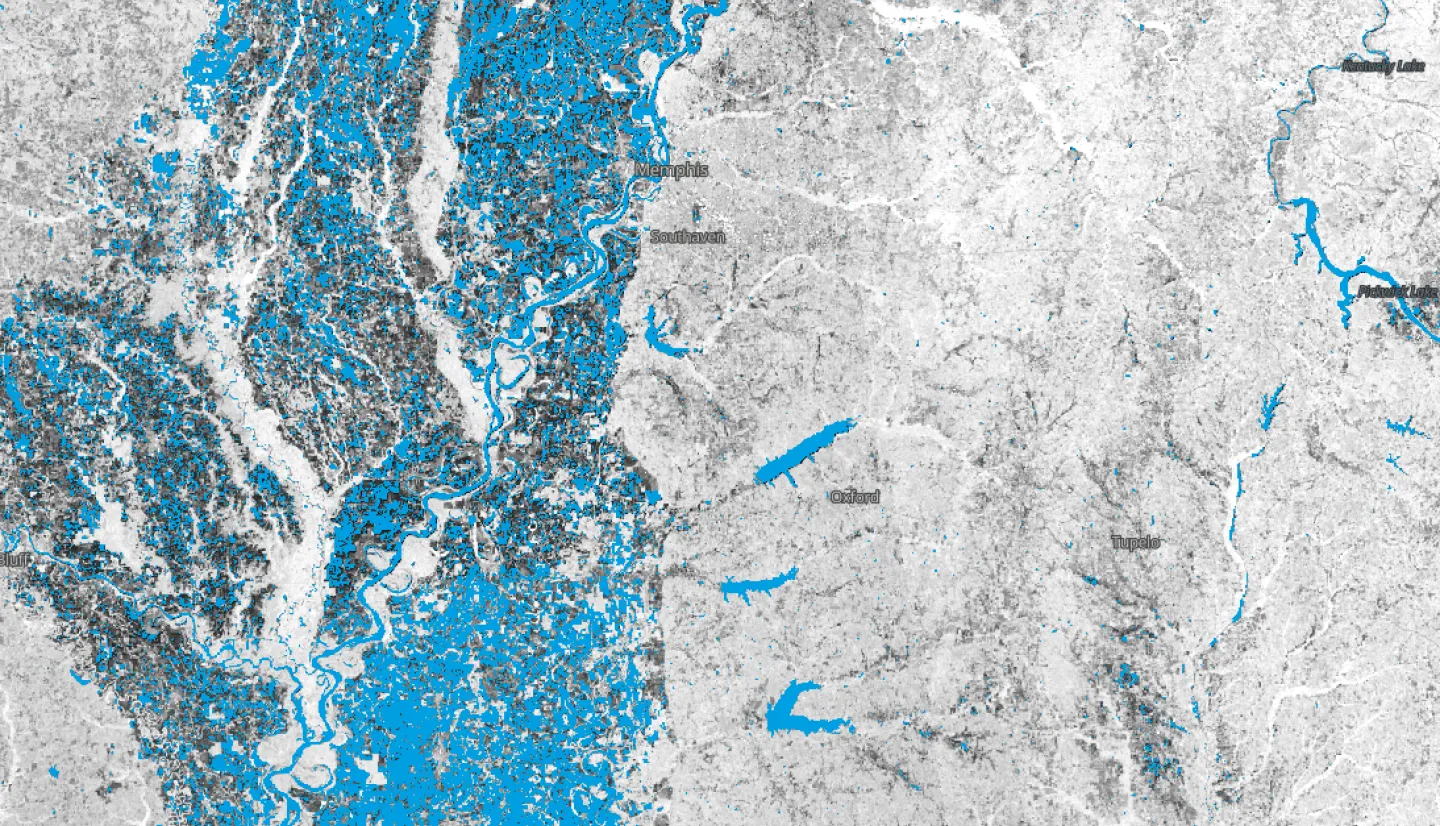
The Copernicus Sentinel-1 satellite collected synthetic aperture radar (SAR) imagery over the southeast and central U.S. from April 4-9, 2025, capturing flooding from severe storms. On the left, HydroSAR surface water extents are shown in blue. These are overlaid on VH cross-pol SAR imagery (grayscale), in which still water and other flat surfaces appear black, while diffuse scatterers like vegetation appear in lighter shades. On the right, USGS National Land Cover Database data indicates whether affected areas may be developed, cropland, forest, or other classes of land use. Credits: (left) NASA Disasters Program, Alaska Satellite Facility. Contains modified Copernicus Sentinel data (2025) processed by ESA. (right) US Geologic Survey National Land Cover Database 2019 as published by U.S. Environmental Protection Agency, Office of Mission Support; Data Steward: Multi-resolution Land Characteristics Consortium.
HydroSAR At-A-Glance
- Uses: Identify the location of water on Earth’s surface.
- Satellite & Instrument: Copernicus Sentinel-1 SAR
- Spatial Resolution: 30m
- Product Frequency: 6-12 days, depending on location
- Product Page
When floods strike, tracking the location of floodwaters is critical to assessing damage and planning resource deployment for response and recovery. With their spaceborne vantage, satellites can rapidly provide awareness of flooding over large areas. Water extent products can be derived from a variety of satellite instruments, including active radar sensors and passive optical sensors.
HydroSAR products use Copernicus Sentintel-1 synthetic aperture radar (SAR) data to detect water on Earth’s surface, including both existing waterways and flood waters. When compared with land classification datasets, such as the U.S. Geological Survey National Land Cover Database that identifies existing waterways, urban areas, croplands, and forests, GIS specialists can flag where identified waters may be impacting urban and agricultural areas. NASA also produces daily near real-time flood hazard and surface water products using the MODIS instrument aboard NASA’s Aqua and Terra satellites, available as 1-day, 2-day, and 3-day composites.
The HydroSAR product suite includes radiometrically terrain corrected (RTC) polarization imagery (co- and cross-pole: VV/VH) and false color Red Green Blue (RGB) composite imagery derived from the dual-pol (VV/VH) RTC products. The RGB imagery is designed to highlight areas of water, vegetation and urban areas, similar to how users would view visible satellite imagery. SAR data can also be used in before-after comparisons, including change detection or time series, but this requires additional processing. Reach out at drcs@nasa.gov to learn more about how you can access these types of products.
HydroSAR was developed by researchers at the Alaska Satellite Facility at the University of Alaska Fairbanks, NASA’s Goddard Space Flight Center, and NASA’s Marshall Space Flight Center, and was funded in-part by the NASA Disasters Program. To learn more about HydroSAR and access its open-source code please visit: https://github.com/HydroSAR.
To learn more about the uses of synthetic aperture radar data, visit this training course from NASA’s ARSET program: An Introduction to Synthetic Aperture Radar (SAR) and its Applications
Black Marble Nighttime Blue/Yellow Composite

This time-series map shows daily Black Marble Nighttime Blue/Yellow Composite imagery from March. 29 – April 10, 2025 in parts of Missouri, Arkansas, Kentucky and Tennessee. The imagery reveals surface lights, indicative of human activity, and clouds. While power outages were minimal for this incident, Black Marble imagery allows users to view prolonged outages in rural communities and power restoration over time. Credits: NASA/GSFC/ESDIS
Black Marble Nighttime Blue/Yellow Composite At-A-Glance
- Uses: See nighttime lights on Earth, which can help identify regions potentially without power.
- Satellite & Instrument: NASA/NOAA Suomi-NPP VIIRS
- Spatial Resolution: ~500m
- Product Frequency: Daily
- Product Page
Flooding and high winds from severe weather often damage power infrastructure, leaving residents without power for days or weeks at a time. NASA’s Black Marble products show lights on Earth at night, enabling identification of lights from cities, fires, boats, and other phenomena. When viewed over time, these products can aid in identifying potential power outages caused by a disaster. These can augment utility company data to enhance awareness of prolonged power outages in rural, isolated, and off-grid communities.
The Black Marble Blue/Yellow product represents a false color band combination of day night band (DNB) and M15 band data collected by the Suomi-NPP VIIRS instrument. Nighttime city lights appear in shades of yellow, while clouds appear in shades of blue to yellow/white. This at-sensor imagery is not corrected for atmospheric effects, such as illumination from the moon. The imagery is a daily composite assembled from hundreds of individual data files, and the daily cadence makes this a valuable tool for tracking power loss over time in comparison with other Black Marble products.
Black Marble is developed by a team of researchers at NASA’s Goddard Space Flight Center, and the near real-time version is produced by NASA’s Land, Atmosphere Near-real-time Capability for EOS (LANCE). The Blue/Yellow composite algorithm was originally designed by the U.S. Naval Research Laboratory before being incorporated into NASA’s research and applications efforts.
To learn more about NASA’s Black Marble products, visit: https://blackmarble.gsfc.nasa.gov
LHASA Global Landslide Nowcast
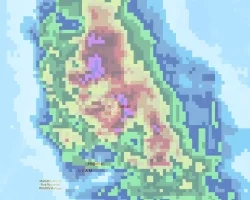
This map shows the LHASA global nowcast product, showing the probability of landslides hazards for the next day (tomorrow). Blue indicates very low probability of landslide hazards in that area, yellow and orange indicate moderate to high, and red indicates very high. Credit: NASA Disasters Program, NASA Landslides Team
LHASA At-A-Glance
- Uses: Assess the likelihood of landslides occurring anywhere on Earth in near real-time.
- Satellites / Models: Machine learning model with NASA GPM IMERG precipitation data, NASA SMAP soil moisture data, and NASA GEOS-FP forecast data
- Spatial Resolution: 1km
- Product Frequency: Every 12 hours, with information for yesterday, today, and tomorrow.
- Learn more
Heavy rain and flooding often trigger devastating landslides, especially in hilly and mountainous regions. Landslides can be difficult to identify on the ground due to their localized nature and the many complex factors that combine to trigger them. NASA’s Landslide Hazard Assessment for Situational Awareness (LHASA) product uses near real-time NASA IMERG satellite precipitation estimates and a machine learning model trained on land-surface information and historical data to assess the likelihood of landslides occurring anywhere in the world. Using this model, emergency managers can gain awareness of areas that may be experiencing increased landslide hazard risk, which can aid in identifying areas impacted by landslides and deploying resources. LHASA is particularly valuable in countries that lack adequate hazard early-warning systems and other resources for effective disaster risk reduction and recovery.
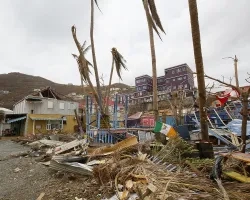
LHASA is available as both nowcasts and forecasts, letting users assess landslide hazard likelihood in the past and near future. The NASA Disasters Program also uses several other techniques to help response organizations assess landslide hazards, including manual and machine-learning-enhanced landslide identification using high-resolution optical satellite data. During the devastating floods that struck western North Carolina and surrounding regions in the wake of Hurricane Helene in Oct. 2024, NASA researchers used optical satellite imagery to map over 200 landslides, contributing to the USGS landslide mapping dashboard for the event.
LHASA is developed by the NASA Landslides team based at NASA’s Goddard Space Flight Center, and its development was funded in-part by the NASA Disasters Program. In 2023, the NASA Disasters Program partnered with Pacific Disaster Center to integrate LHASA into their DisasterAWARE multi-hazard early warning and monitoring platform, making LHASA more accessible for tens of thousands of users around the world.
To learn more about LHASA and other NASA Landslides projects, visit https://landslides.nasa.gov
These tools equip emergency managers in the U.S. and around the world with enhanced situational awareness to aid decision-making when floods and other disasters strike. Using advanced Earth observation instruments combined with cutting-edge science, NASA is putting Earth science to action to build resilience in communities around the world.
Additional Resources
- View the full list of near real-time products on the NASA Disasters Mapping Portal.
- Visit the NASA Disasters Mapping Portal to view more NASA GIS resources for disasters: https://maps.disasters.nasa.gov
- Visit the NASA Disasters Response Coordination System website, or email drcs@nasa.gov, to learn how NASA can support your organization’s emergency response needs: https://disasters.nasa.gov/response