Displaying 271 - 280 of 466
![Median day time Land Surface Temperature (LST) calculated using June – September 2016 – 2021 thermal imagery from Landsat 8 TIRS. Displayed is the city of Yonkers, located in Westchester County, directly north of the Bronx in New York City and right of the Hudson River. Shades of yellow–red indicate high LST. Green–teal shades indicate cooler LST. Solid purple represents water bodies. Focusing on yellow-red areas allows the city of Yonkers to prioritize heat mitigation strategies.](/sites/default/files/styles/lis/public/2022-03/2021Fall_AZ_YonkersUrbanII_WebsiteImage_1440.png.webp?itok=l-QdbVsl)
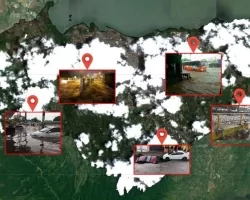
Yonkers Urban Development II (Fall 2021) Team: Tamara Barbakova (Project Lead), Akshay Agrawal, Amanda Trakas, Kyle Pecsok, and Lauren Mahoney Summary: The City of Yonkers...
![This image depicts chlorophyll-a concentrations along the Southern California Coast during a Harmful Algae Bloom, also known as a Red Tide Event. The ocean imagery was taken in April of 2020 by Aqua MODIS and used to generate chlorophyll-a concentration. The land imagery was taken by Sentinel-2 MSI during the same time period, and a Normalized Difference Chlorophyll Index was applied to it for visualization purposes. Blue and green indicates high and low chlorophyll-a concentrations, respectively. On land,](/sites/default/files/styles/lis/public/2022-05/2021Fall_ARC_SoCalHAQ_WebImage.png.webp?itok=1m8SL35K)
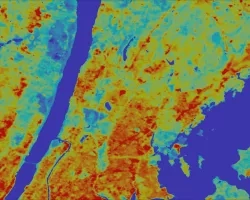
Southern California Health & Air Quality (Fall 2021) Team: Michael Enz (Project Lead), Melanie Leung, Maya Zimmerman, Jonathan Van Dermark, and Petra Nichols Summary: In...