Imagine being able to predict streamflow on every river and stream in the world for the next 15 days! With our global streamflow modelling and simulation product and web applications this is now possible. What can be done with these forecasts when they are combined with other Earth observation data? Many decision support tools and applications are being developed to address specific challenges in regions throughout the world, and we have created an “App Store” for web applications where resource managers can quickly find the apps that will help them in their regions and install them on their own servers to support their own users!
GEOGloWS seeks to enable earth scientists to solve the challenges associated with achieving Global Water Sustainability. This project, using the existing Tethys infrastructure, built out the earth science cyberinfrastructure (CI) for the GEOGloWS and larger GEO software ecosystem to overcome the limitations of storage, processing speed, transmission bandwidth, and platform dependency associated with desktop computing. The work is also being integrated with the AmeriGEO platform to rapid deploy open source hydroinformatics apps for managing and using essential water resources variables.
Key Results Include
- GEOGloWS App Warehouse: GEOGLOWS Toolbox allows Tethys Portals to be created for any organization and apps added as they are or “adapted” for specific use.
- Developed seven Earth observation and Water Resources Web Apps for Decision
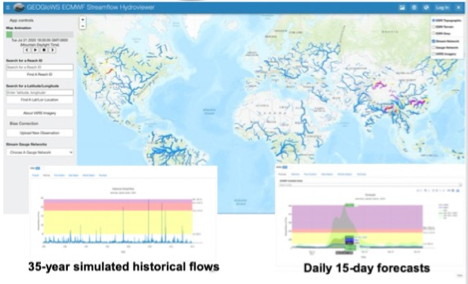
- Global Streamflow Forecasts – 35 years of simulated historical streamflow globally; daily 15-day streamflow forecasts for nearly every stream segment in the world.
- HydroViewer – Customized streamflow forecasts and additional data for specific regions. Available in the following regions: Bangladesh, Nepal, Dominican Republic, Colombia, Central America, Ethiopia, and Ivory Coast.
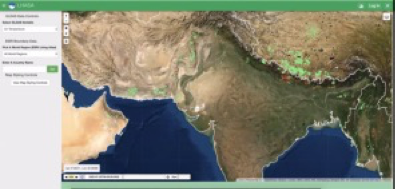
- GLDAS Viewer –Interrogation of the Global Land Data Assimilation System (GLDAS) data services.
- GFS Viewer – Access to Global Forecast System data to explore local and regional variability in these datasets.
- HydroStats – Visualization and validation of hydrological time series data.
- GRACE Groundwater – Displays global changes in water storage using data provided by the NASA JPL GRACE satellites.
- Groundwater Level Mapper – Correlates Earth observations and water table fluctuations.
- Held a first ever SERVIR/GeoGLOWS (virtual) weeklong hackathon with over 50 participants from around the globe resulted in new app.
Peer Reviewed Publications:
- Evans, S., Williams, G., Jones, N., Ames, D.P., Nelson, E.J., 2020. Exploiting Earth observation Data to Impute Groundwater Level Measurements with an Extreme Learning Machine. Remote Sensing, vol 12, issue 12. DOI: https://doi.org/10.3390/rs12122044.
- Evans, S., Jones, N., Williams, G., Ames, D.P., Nelson, E.J., 2020. Groundwater Level Mapping Tool: An Open Source Web Application for Assessing Groundwater Sustainability. Environmental Modelling & Software, vol 131, article 104782. DOI: ttps://doi.org/10.1016/j.envsoft.2020.104782.
- Khattar, Rohit and Ames, Daniel P. (2020) "A Web Services Based Water Data Sharing Approach using Open Geospatial Consortium Standards," Open Water Journal: Vol. 6 : Iss. 1, Article 2.