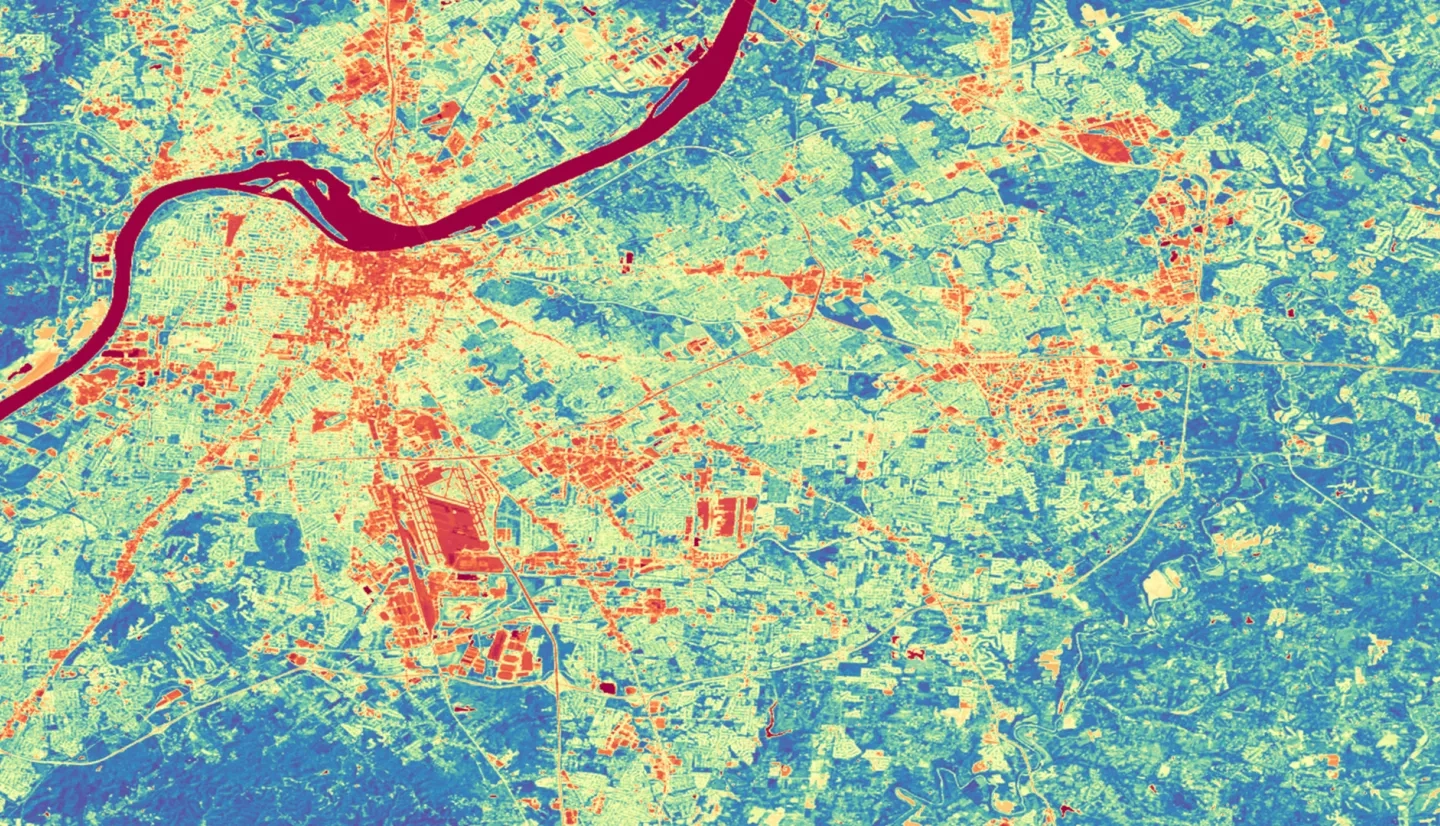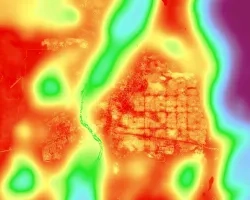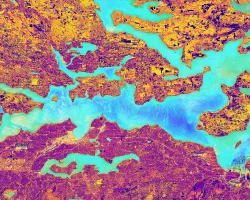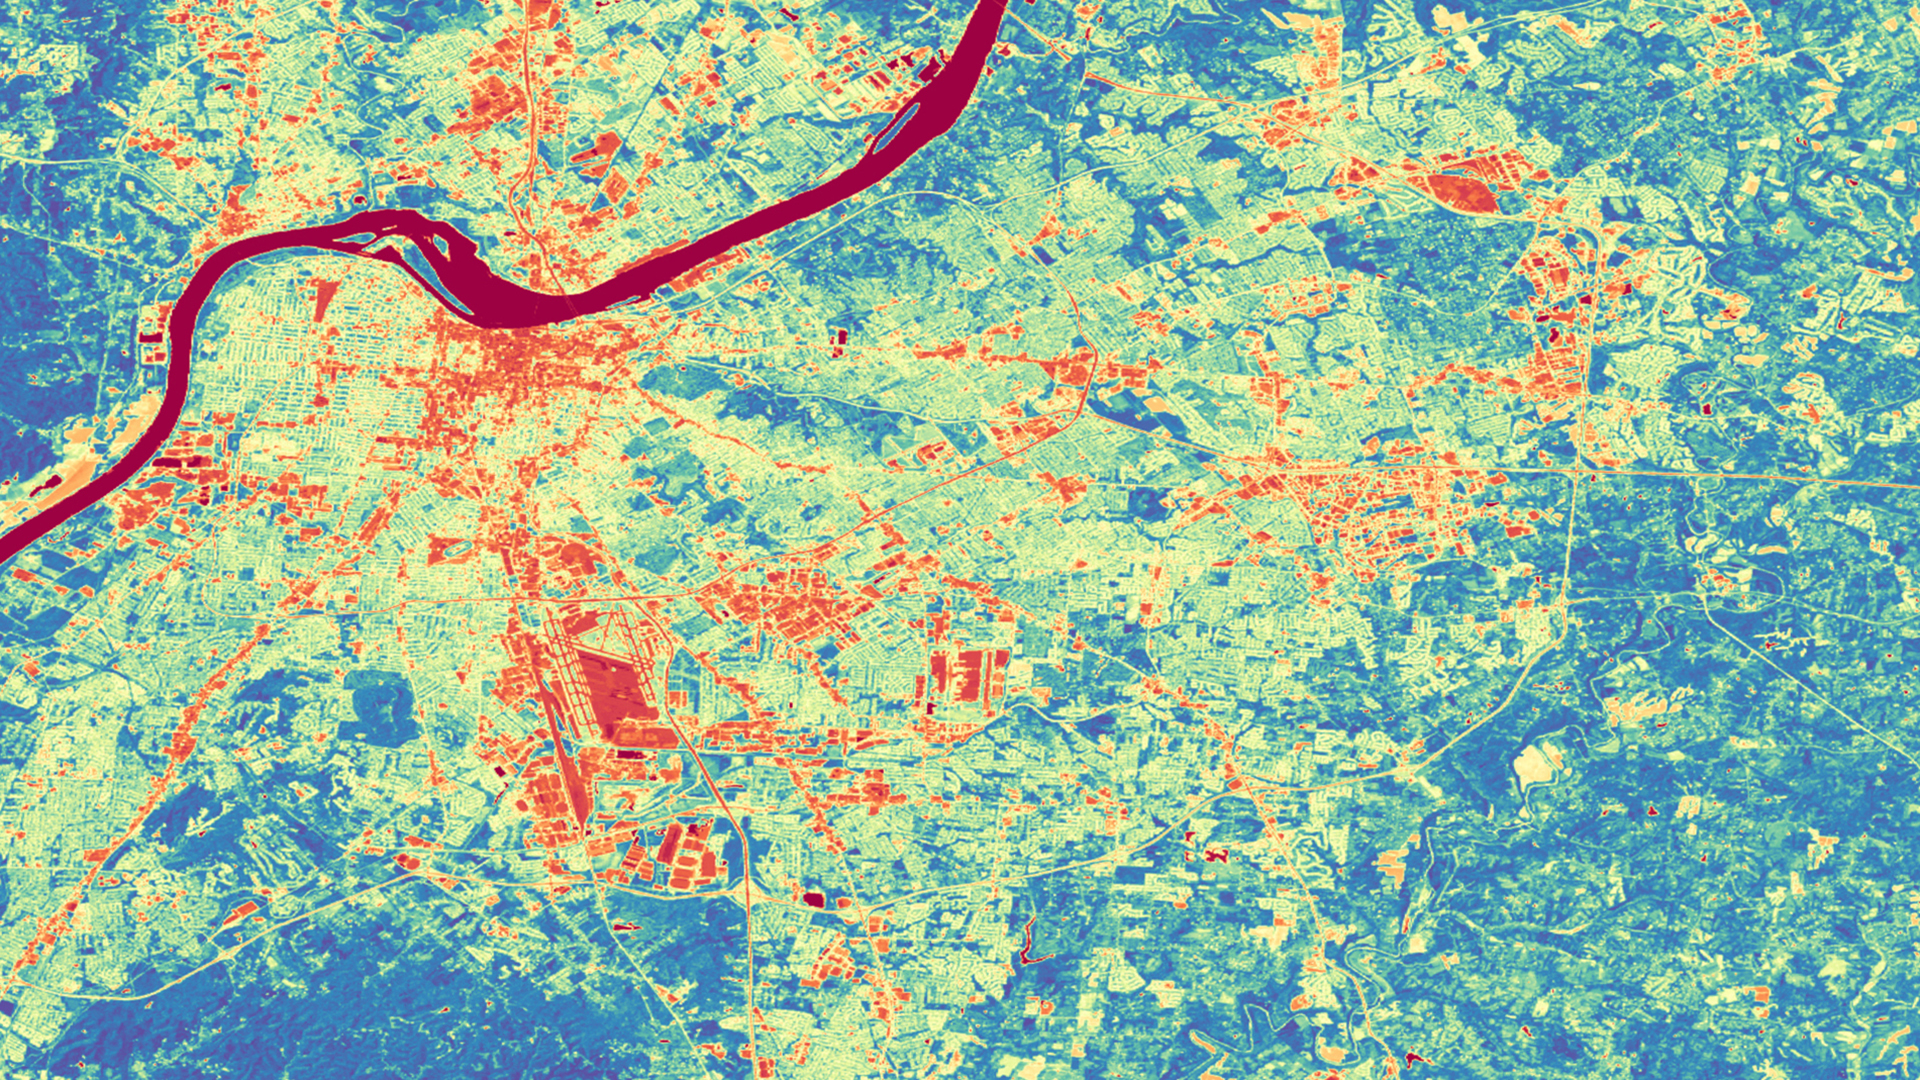
Greenness and land surface temperature (LST) have been extensively correlated to urban public health. Chronic diseases such as diabetes, asthma, and cardiovascular illnesses have been linked to regions of high LST and areas lacking urban green spaces. One of our partners, the University of Louisville Envirome Institute, champions the importance of urban green spaces. Their research has pioneered efforts in increasing the area and accessibility of urban parks and greenspaces as a way to improve public health and combat environmental inequality. Louisville, Kentucky, is currently working to plant and manage urban trees. Our team used NASA Landsat 8 Operational Land Imager (OLI) and Thermal Infrared Sensor (TIRS) imagery to calculate the Normalized Difference Vegetation Index (NDVI) in Louisville at the census tract level and automated the process for use in other cities. The New York University School of Medicine’s City Health Dashboard displays public health metrics across 500 US cities and will use our methods to complete the NDVI analysis for all of these locations plus an additional 293 cities they are adding to their dashboard in the near future. Our NDVI and LST calculations will allow cites across the US to make informed decisions about reducing environmental inequality by focusing on areas with low NDVI and high LST.
