Principal Investigator

Vanesa Martín

Imagen
These are wetlands in southwestern Guatemala. The top image (August 2018) shows the area while it is not flooded, with purple representing water. The bottom image (September 2017) shows flooding in dark purple to blue. The top half is an NDWI image made with Landsat 8 OLI data. The bottom half is an RGB composite using Sentinel-1 C-band SAR. SAR is a useful tool for partner agencies to map flooding since it can penetrate atmospheric conditions, unlike optical imagery.

Central America is one of the world’s most vulnerable regions to natural disasters, including landslides and precipitation-driven flooding. In an effort to support disaster management and emergency response planning, this project developed a methodology that employed NASA Earth observations to...

Principal Investigator

Nicole Pepper

Imagen
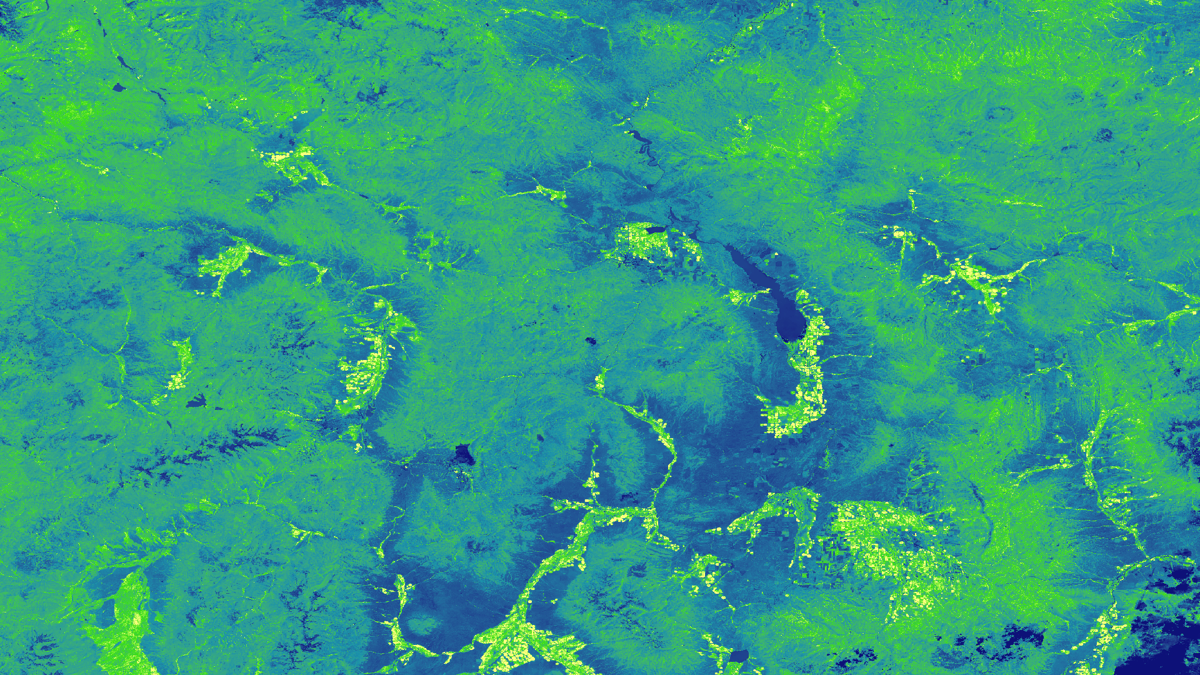
This is a processed Landsat 8 OLI image from January 2019 displaying Normalized Difference Vegetation Index (NDVI) values of Moloka’i, Hawaii. Bright purple colors indicate areas of healthy vegetation and blues represent less productive vegetation, bare ground, and water. NDVI is one of the many indices used to quantify forest health and resulting coastal water turbidity.

threat of invasive species has impacted fragile forests across the globe; such impacts can be particularly damaging on island ecosystems where a loss in vegetation can lead to increased runoff. In 2017, a fungal pathogen outbreak of Puccinia psidii impacted...

Principal Investigator

Jillian LaRoe

Imagen
Employing NASA Earth Observations to Model Availability of Ephemeral Water Sources and Vegetation Change in Support of a USGS Feasibility Assessment and Management Strategy of Bison

The United States Geological Survey (USGS) and National Park Service (NPS) are concerned by the increasing Kaibab Plateau bison population on the North Rim of Grand Canyon National Park (GRCA). Currently, within the park's boundaries, the bison have no predators and hunting is prohibited, resulting...

Principal Investigator

Kaitlin Walker

Imagen
Employing NASA Earth Observations to Model Current and Historic Distribution of Crop Wild Relatives, in Support of USDA ARS Genetic Resource Conservation Efforts

Northern wild rice (Zizania palustris L.) and Texas wild rice (Zizania texana) provide valuable ecosystem services, food sources, economic development, and cultural resources to local populations in Minnesota and Texas. Research on crop wild relatives, wild plants closely related to cultivated plants, is imperative to...

Principal Investigator

Eli Simonson

Imagen
Employing NASA Earth Observations to Model Distributions of Wild Crop Relatives, in Support of USDA ARS Genetic Resource Conservation Efforts

Crop wild relatives (CWR) are genetically related to cultivated crops and function as repositories for genetic diversity. These plants have the potential to improve the yield, nutritional value, and resilience of crops, thereby buffering against widespread crop failure and supporting rural economic productivity. As such...

Principal Investigator

Christine Fleming

Imagen
This is a processed image that shows the average of the Normalized Difference Water Index (NDWI) and the Modified NDWI (MNDWI) derived from June 1, 2017 Landsat 8 OLI data, with yellow and orange colors representing higher wetness relative to the dryer dark blue and green colors. The image shows the southern coast of Lake Ontario, centered on the city of Niagara Falls, New York, and indicates areas inundated by water.

Approximately 11 million people reside in the Lake Ontario watershed. Extreme high water levels in the spring of 2017 caused severe flood damage to communities off the coast of Lake Ontario. Niagara Falls drainage infrastructure did not accommodate floodwater inundation...

Principal Investigator

Henrik Westerkam

Imagen
Employing Remote Sensing Techniques to Quantify Sediment Supply and Evaluate Marsh Vulnerability in the Plum Island Estuary

The Plum Island Estuary (PIE) in Massachusetts is New England's largest salt marsh. This dynamic ecosystem plays an important role in the surrounding communities by providing ecosystem services and acting as a center for education, research, and recreation. However, marshes around the world are threatened...

Principal Investigator

Olivia Landry

Imagen
Displayed is a processed NDVI (Normalized Difference Vegetation Index) image using 2019 Landsat 8 Operational Land Imager red and near infrared bands. The Image shows agricultural zones in Polk County, Iowa. Darker green shades indicate dense healthy vegetation whereas lighter green shades indicate less dense or moderately healthy vegetation. Purple shades indicate water, and wetlands. NDVI values can be used as a proxy of a crop’s performance and help farmers monitor their crops' progress.  Keywords: Olivia Landry (Project Lead), Liam Bhajan, Otto Castillo Altun, Owen Smith, NDVI, Landsat 8 OLI

Farmers across Iowa, Minnesota, and Wisconsin have access to accurate and ample phenological data for large-grain crops like corn and soybeans. These data are useful metrics that describe changes during different stages of crop growth which help farmers evaluate crop...

Principal Investigator

Collin Pampalone

Imagen
Enhancements to Visualization of CALIPSO (VOCAL) through Case Studies of Saharan Dust

The Cloud-Aerosol LiDAR and Infrared Pathfinder Satellite Observation (CALIPSO) satellite's CALIOP sensor generates vertical LiDAR profiles of the atmosphere at a global scale. Currently, the standard visualization tool for these data is written in Interactive Data Language (IDL), a proprietary language that does not support...

Principal Investigator

Alina Schulz

Imagen
NDWI Composite from Landsat 8 tier 1 (2019) is shown with surface slope, derived from a statewide DEM of Maryland (2011), clipped to the border of Howard County, overlaid. The greater Baltimore area is shown; the merge of the Patapsco River and the Chesapeake Bay is seen lower right. Lighter shades of blue indicate higher surface and plant water content. In regards to the DEM, yellow shows a high degree of slope, while purple shows low slope. The convergence points of several watersheds along the Patapsco river (bright yellow border) can be identified, including the Tiber-Hudson watershed at Ellicott City. High NDWI values and steep slopes indicate areas in danger of flooding due to runoff.  Keywords: DEM, Landsat 8, NDWI, Ellicott City, watershed

As flooding events in the United States grow in frequency and intensity, the use of technological advancements and applied science are increasingly necessary for effective flood monitoring and warning systems. The NASA DEVELOP Ellicott City Disasters II project investigated the...