Imagen
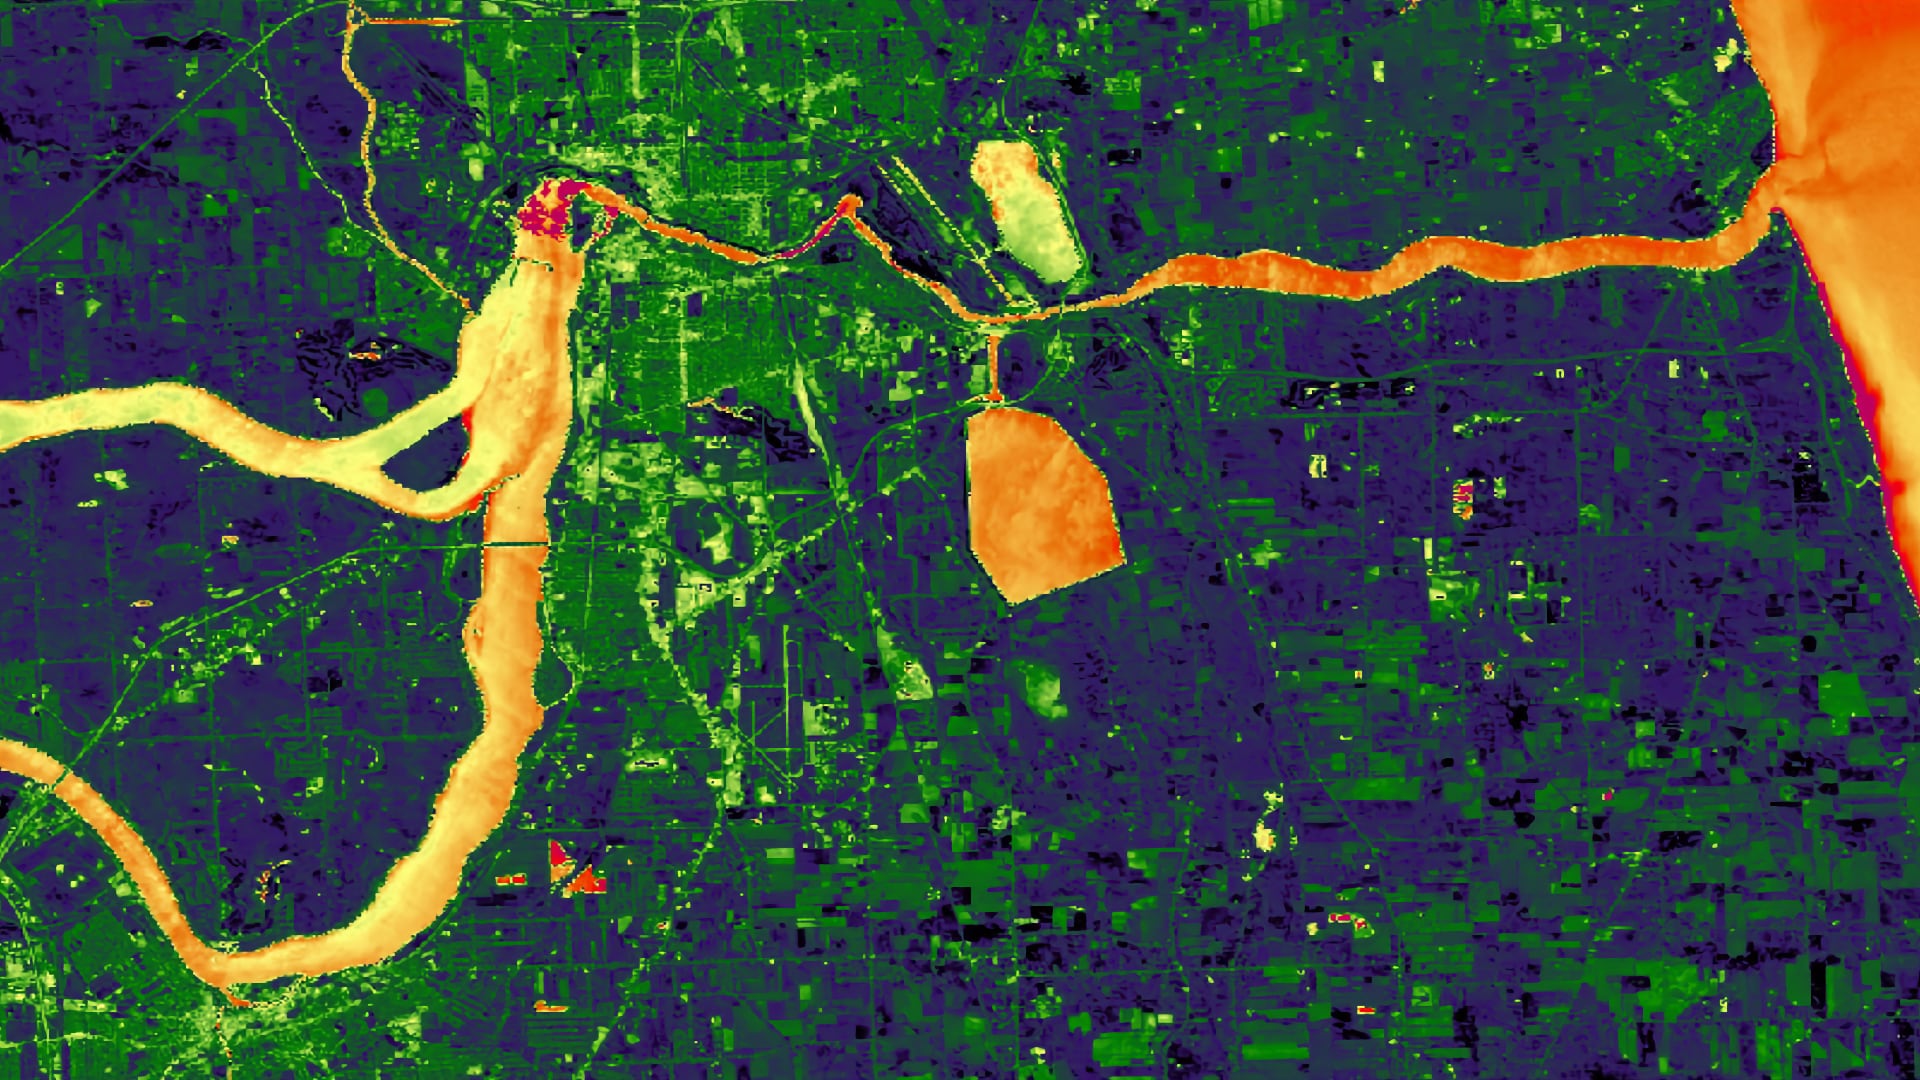
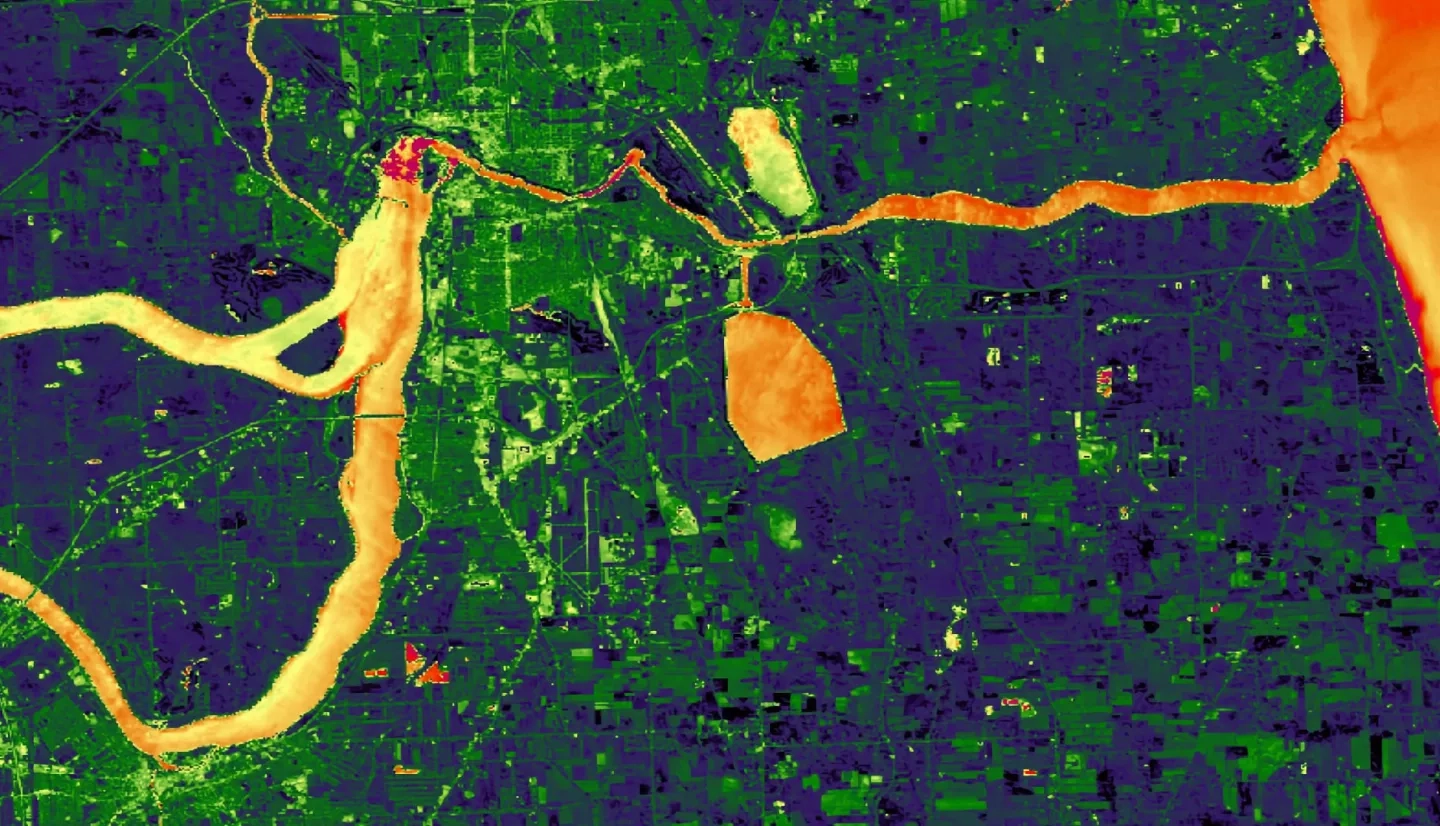
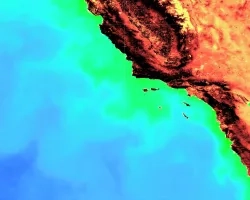
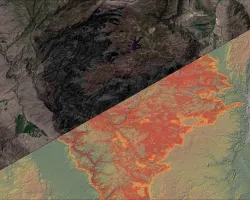
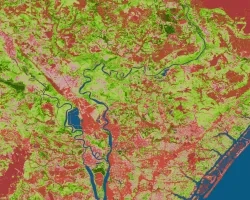
Approximately 11 million people reside in the Lake Ontario watershed. Extreme high water levels in the spring of 2017 caused severe flood damage to communities off the coast of Lake Ontario. Niagara Falls drainage infrastructure did not accommodate floodwater inundation, which led to the destruction of property and unsafe conditions for residents. City management required further assessment of maximum flood extent and regional impacts in order to determine high flood risk areas. The Niagara Falls Disasters team partnered with the City of Niagara Falls, the Great Lakes and St. Lawrence Cities Initiative, Cornell University, and University of Michigan to map flood extent and create tools to assess relevant environmental parameters used in flood risk evaluation. The team used Google Earth Engine to identify river and coastline changes in the Niagara Falls, NY region. Additionally, the team evaluated various environmental parameters derived from NASA Earth observations, including snow and ice cover, precipitation, and soil moisture, and generated time series analyses for the months prior to and during the 2017 flood event. These products will allow the partners to better prepare at-risk communities for future extreme weather events.