Description
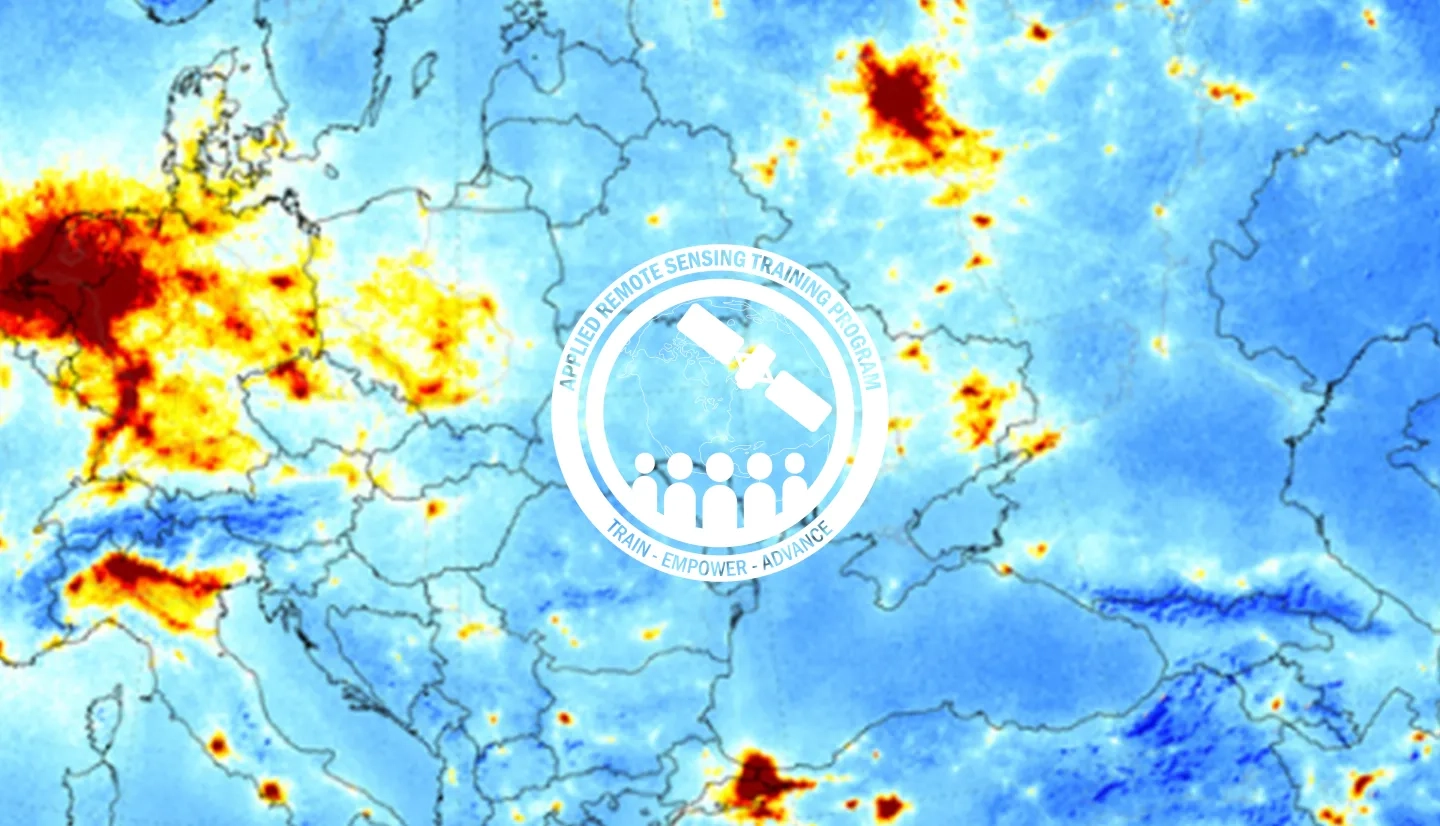
Nitrogen dioxide (NO2) is unhealthy to breathe and is a necessary ingredient for the formation of unhealthy levels of surface ozone [NASA Air Quality]. NASA Aura's OMI sensor has been monitoring NO2 data since 2004 and has been used in a variety of health and air quality applications. The TROPOMI instrument onboard Sentinel-5P, launched in 2017, represents a significant improvement in spatial resolution over OMI. It will be better-suited for many applications currently using OMI data, including monitoring air pollution. In this advanced webinar, attendees will learn how to access and analyze TROPOMI data and learn about its applications.
- Fundamentals of Remote Sensing
- Download and Install Python with Anaconda
- Register for EO Browser & Sentinel Hub
- Create a Login for Earthdata
- Install Panoply for Part 2
- Download the following data for Part 2 (you need an Earth Data login to download)
- Attendees that do not complete the prerequisites may not be adequately prepared for the pace of the training.
By the end of this training, attendees will be able to:
- Understand the available data products
- Access and download TROPOMI data
- Analyze the data using Python tools
This webinar is intended for end-users who are already familiar with satellite observation capabilities and have used online image archives or analysis tools at basic to intermediate levels for air quality applications, such as emissions estimation using satellite observations.
- Parts 1 & 2 will be one hour long.
- Part 3 will be 2 hours long and include an opportunity for attendees to practice using TROPOMI data.
This webinar will provide an introduction to remote sensing of air quality, a description of OMI, an overview of available data products for NO2, and available data portals and tools.
Materials:
This webinar will cover an introduction to TROPOMI, available data products for NO2, information about products detecting AI, CO, SO2, and HCHO, an overview of accessing TROPOMI data, and an exercise for downloading the data.
Materials:
This webinar will primarily consist of going through an exercise on using updated python codes to work with TROPOMI data. This will include reading, mapping, extracting over a point location, gridding the data, and dumping the data to a CSV file.
Materials:
- Presentation Slides
- Q&A Transcript
- OMI Python Code & Data
- TROPOMI Python Codes & Data (Aerosol Index, CH4, CO2)
- TROPOMI NO2 Data
- Python Test Code


