Published
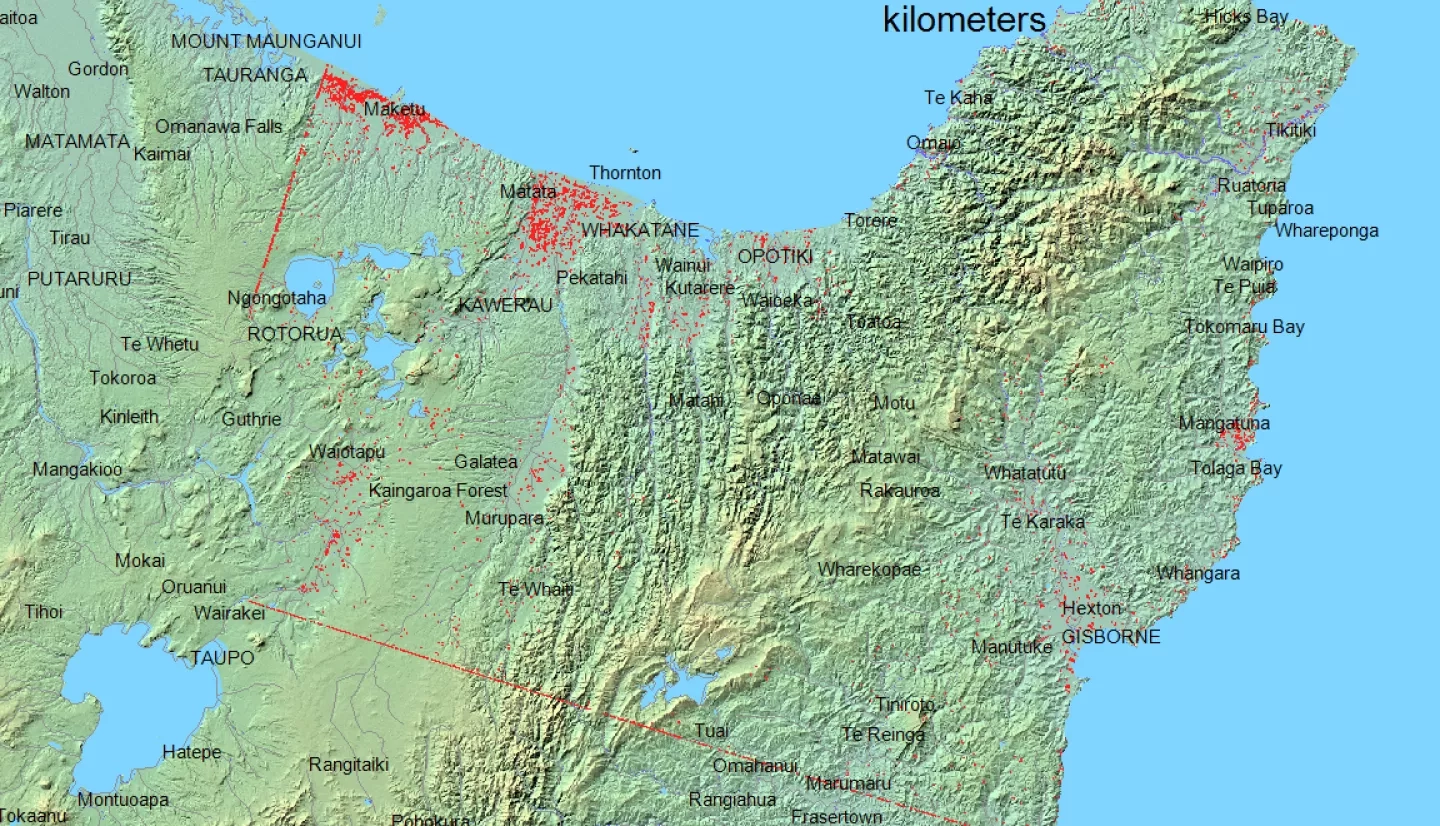
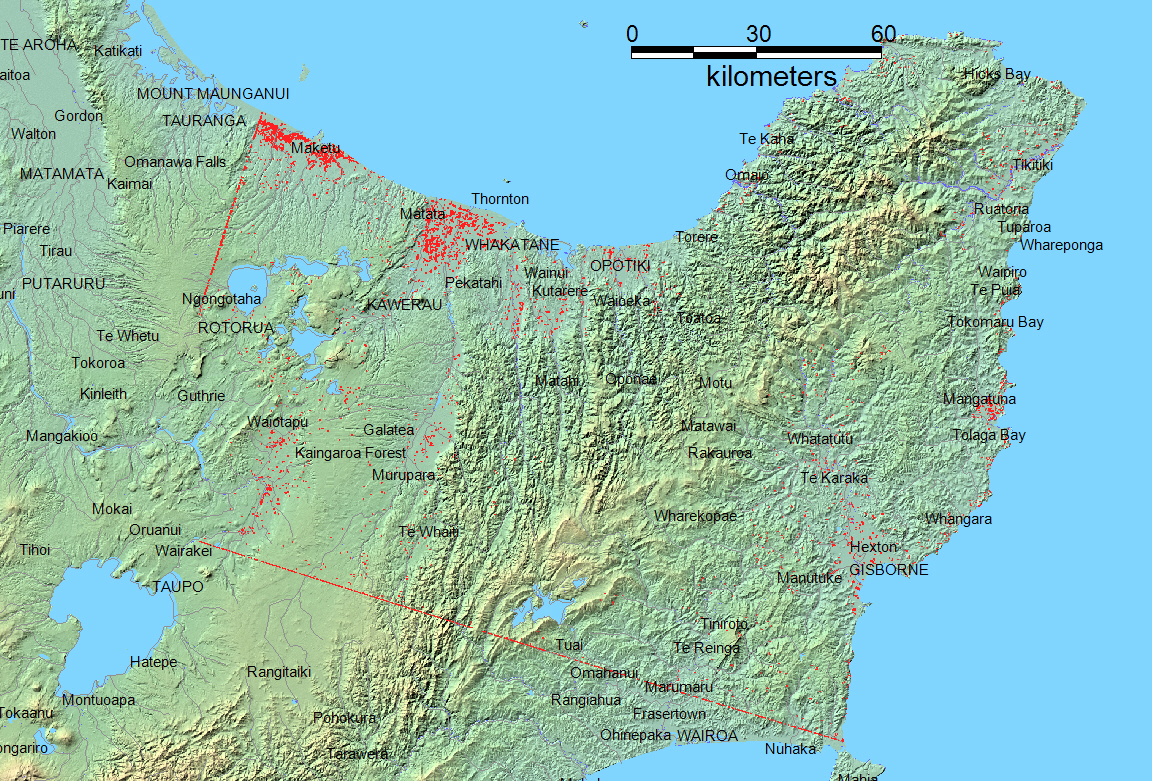
Below are images of a SAR Flood Map derived from ESA Sentinel-1 data for April 4, 2017. Flood regions were detected by measuring the difference in radar images acquired on April 4 and March 11 by Sentinel-1. Newer products will be developed when the data becomes available from ESA. On the KML file, red areas indicate flood presence. The point of contact for this data is: robert.brakenridge@colorado.edu
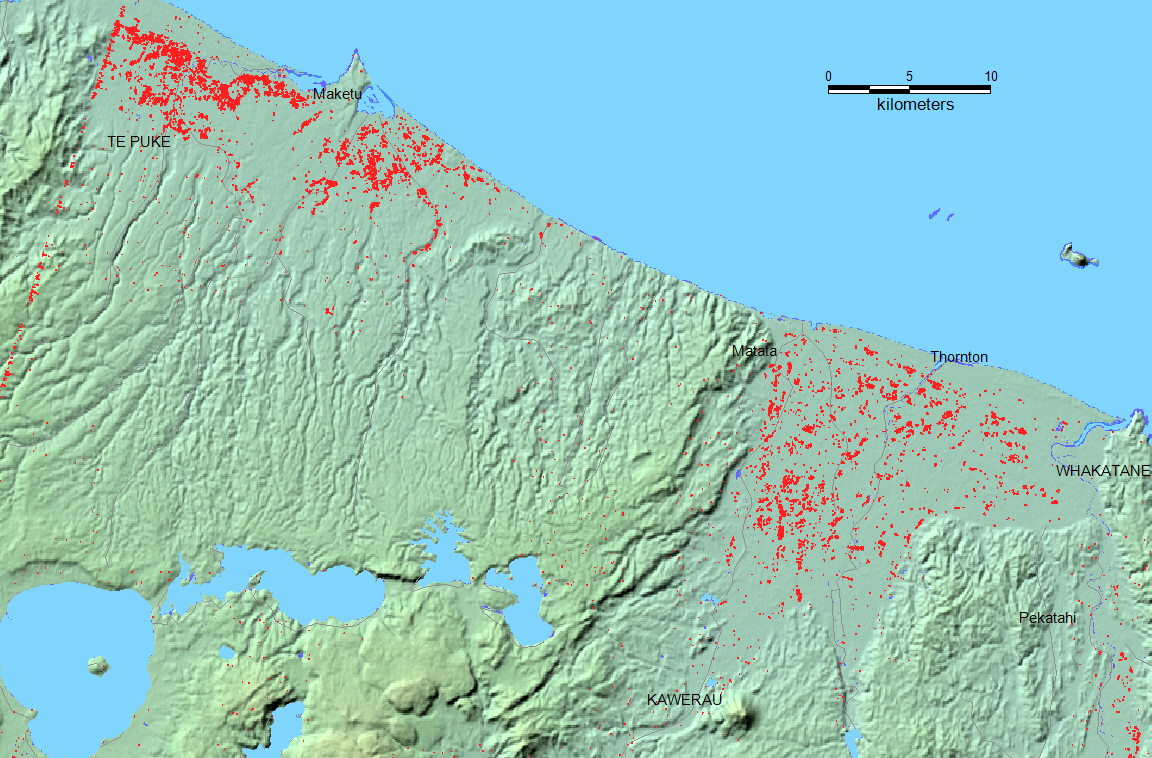
Layers, top to bottom: Light Blue is reference water extent mapped via NASA 90 m (spatial resolution) SWBD. Red is flood water mapped from ESA Sentinel 1 SAR data. Dark Blue is all previous satellite-mapped flooding. If visible, straight red markings define limit of satellite coverage.
Detail View:
665