UPDATE 9/18/18:
Over the weekend #HurricaneFlorence brought torrential rains and record flooding to the Carolinas. This GPM IMERG visualization shows storm-total accumulated rainfall on the left for 9/12/18 - 9/17/18 vs. a sequence of 3-hour accumulations on the right https://t.co/numzHJXzb2 pic.twitter.com/pzAgkVrRXl
— NASA Precipitation (@NASARain) September 17, 2018
UPDATE 9/14/18:
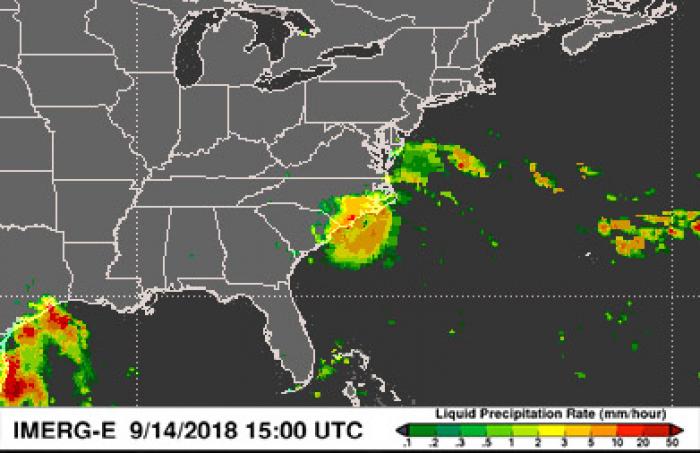
This image of precipitation rates within in Hurricane Florence was generated from the Integrated Multi-satellitE Retrievals for GPM (IMERG) data product. This is the near-realtime "early run" product, which is generated by NASA's Precipitation Processing System every half hour with a 6 hour latency from the time of data acquisition. It is produced using data from the satellites in the GPM Constellation, and is calibrated with measurements from the GPM Core Observatory as well as rain gauge networks around the world.