Multiple threatening tropical cyclones spun over the Pacific Ocean in August 2018. In the northwest Pacific basin, typhoons Soulik and Cimaron took aim at Japan and the Korean Peninsula. Then Hurricane Lane lined up in the tropical Pacific for an encounter with the Hawaiian Islands.
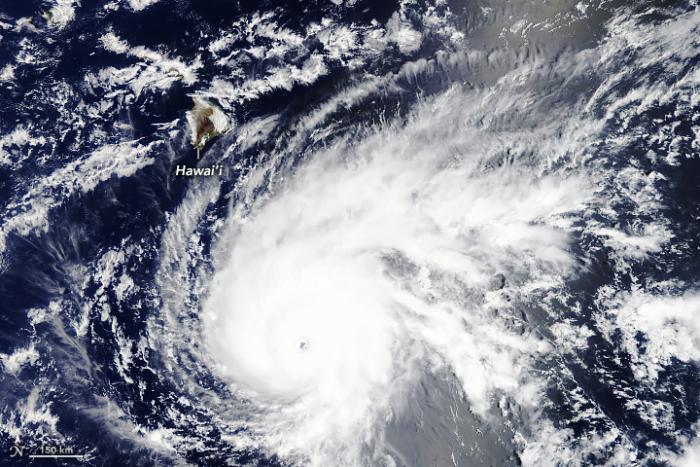
At 10:45 a.m. Hawaii Standard Time (20:45 Universal Time) on August 21, 2018, the Moderate Resolution Imaging Spectroradiometer (MODIS) on NASA’s Terra satellite acquired this natural-color image of Hurricane Lane. Around that time, Lane was a powerful category 4 hurricane with maximum sustained winds of 250 kilometers (155 miles) per hour. The storm’s center was 925 kilometers (575 miles) south-southeast of Honolulu. By that evening, Lane intensified to a category 5 storm.
Direct hits on the Hawaiian Islands are rare, but plenty of storms get close. Hurricanes Madeline and Lester threatened the islands in August 2016, but both storms weakened and passed without a direct hit.
The exact track that Hurricane Lane will take remains to be seen. Forecasts from the Central Pacific Hurricane Center called for the storm’s center to curve northwest then north-northwest, bringing it “very close to or over the main Hawaiian Islands” from August 23 through 25. According to the National Weather Service in Honolulu, only one other category 5 hurricane in database records passed within 560 kilometers (350 miles) of Hawaii.
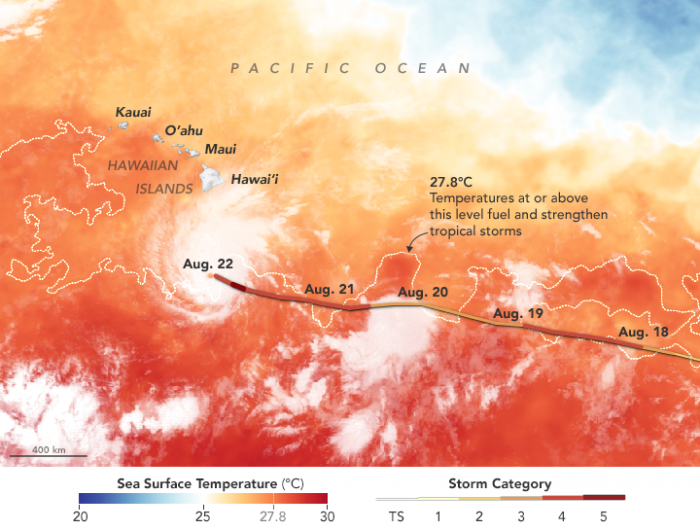
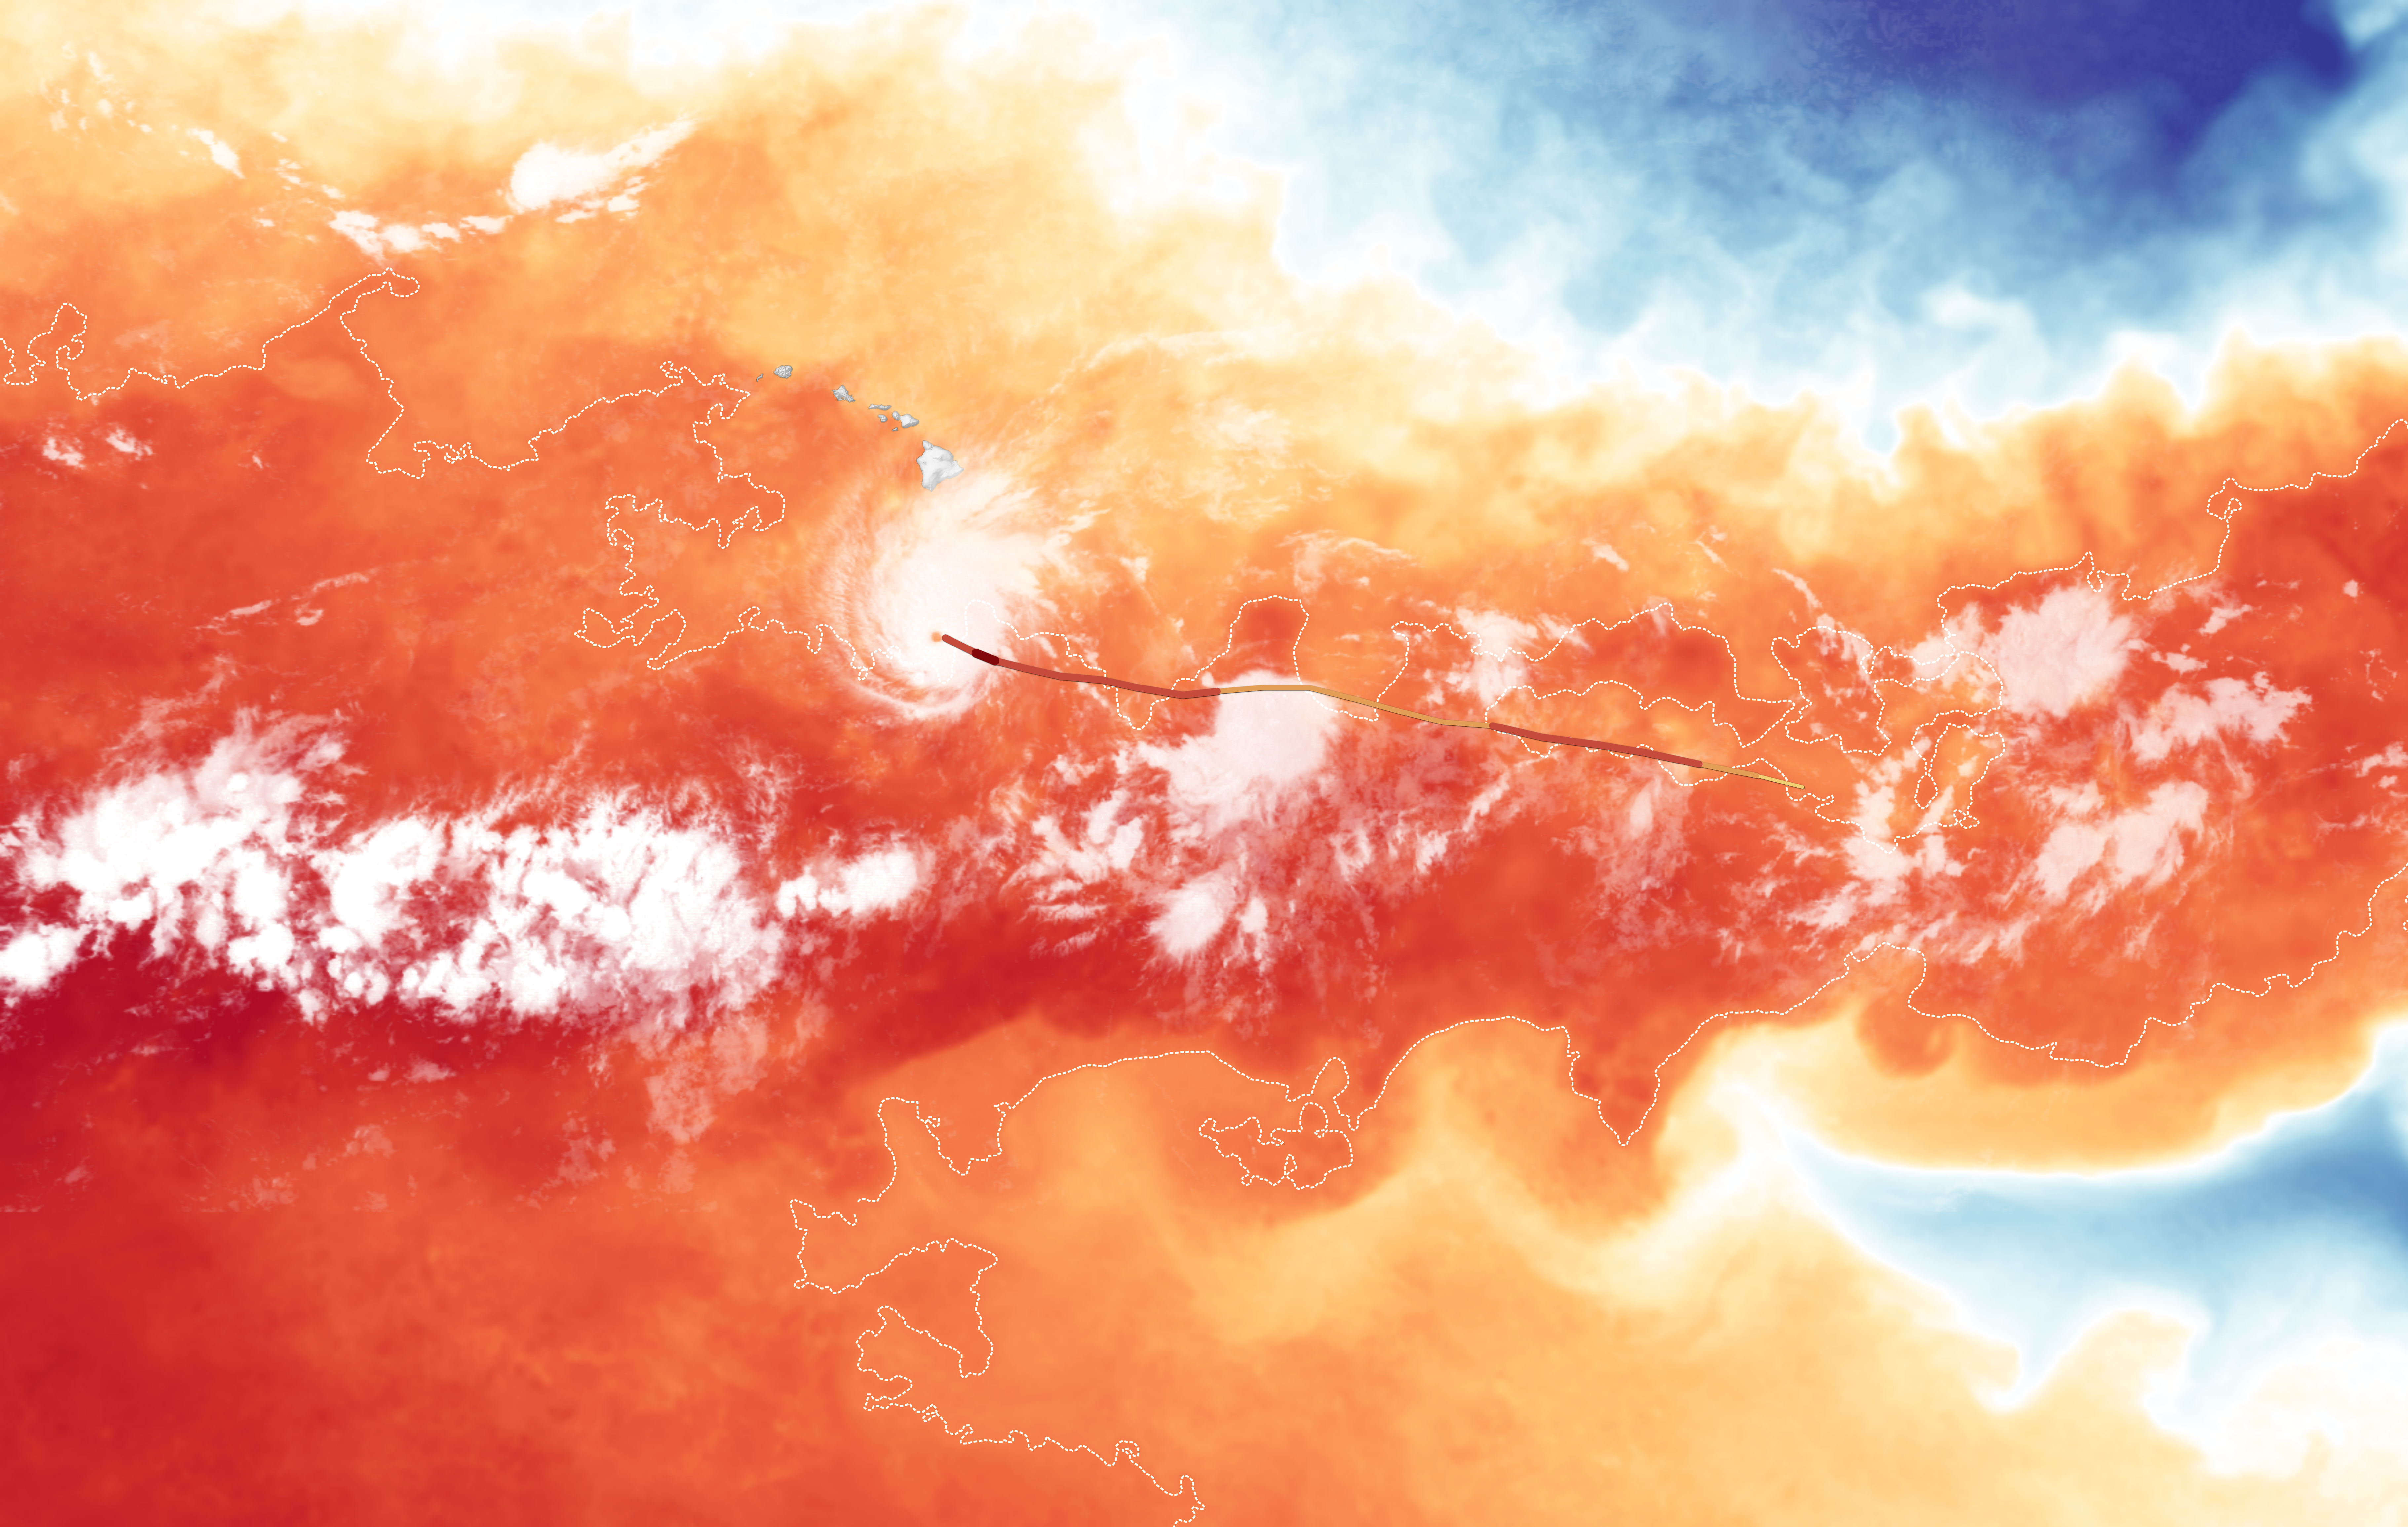
The westward path of Lane’s track from August 17 to August 22 is shown above. (View the large image to see the storm track from August 15 onward.) The track is overlaid on a map of sea surface temperatures in the tropical Pacific Ocean on August 21, 2018. Temperature data were compiled by Coral Reef Watch, which blends observations from the Suomi NPP, MTSAT, Meteosat, and GOES satellites, and computer models.
The map highlights sea surface temperatures of 27.8°C (82°F), a threshold that scientists generally believe to be warm enough to fuel a hurricane. According to the Central Pacific Hurricane Center, water temperatures along the forecasted track (not shown) were expected to stay between 27°C and 28°C, which is “warm enough to support a major hurricane.”
References & Resources
- Central Pacific Hurricane Center (2018, August 22) Powerful Hurricane Lane Continues Moving West Northwestward Toward the Main Hawaiian Islands. Accessed August 22, 2018.
- Hawaii News Now (2018, August 15) Lane bearing down on Hawaii as a powerful Category 4 hurricane. Accessed August 22, 2018.
- National Weather Service (2018, August 22) NWS Forecast Office Honolulu, HI. Accessed August 22, 2018.
- The Washington Post (2018, August 22) Category 4 Hurricane Lane bears down on Hawaii. Watches and warnings cover island chain. Accessed August 22, 2018.