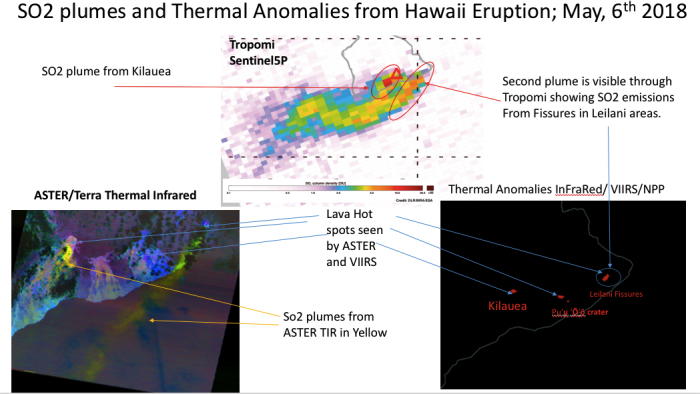
The slide shows a composite of satellite products to highlight plumes of Sulfur Dioxide and Hot spots from Lava erupting from Mt Kilauea and the new Fissures observed since May 3rd and May 4th in the Leilani areas. The top panel shows a map of SO2 from the Tropomi sensor on the ESA Satellite Sentinel 5P for May 6th. Two main SO2 plumes are seen on the map emerging from the Kilauea crater ( Red triangle) and another source to the East is also visible. They eventually join further south to form only one big plume. Thermal Anomalies from NASA’s ASTER and VIIRS sensors on Terra and SNPP Satellites show the position of hot spots visible through Infrared sensors from both instruments. The so-called Lava Hot Spots are visible near the Kilauea crater, the Puʻu ʻŌʻō crater and the new fissures which have appeared on May, 3rd and May, 4th near the Leilani location, south of Pahoa. The ASTER yellowish color indicates the presence of SO2 in the atmosphere and confirm the presence of two main sources venting out from Kilauea and Leilani areas. Altogether, those information can provide a view of the complex volcanic activities occurring in the Hawaii big Island and shed light on Lava spots and SO2 emissions venting out in the atmosphere which is affecting population on the ground.
Those information can be used to highlight areas affected by dangerous levels of sulfur Dioxide which can have serious health impacts for people on the ground. Thermal Anomaly maps are used to locate hot spots where Lava is erupting. The relative high resolution from ASTER and VIIRS (300-400m) are really unique to locate the new fissures which occurred in Leilani areas on May 3rd and May 4th and forced the evacuation of more than 1000 people.