NASA and its partners are contributing important observations and expertise to the ongoing response to the September 19, 2017, magnitude 7.1 Puebla earthquake in Mexico. This earthquake has caused widespread building damage and triggered landslides throughout the region, including Mexico City.
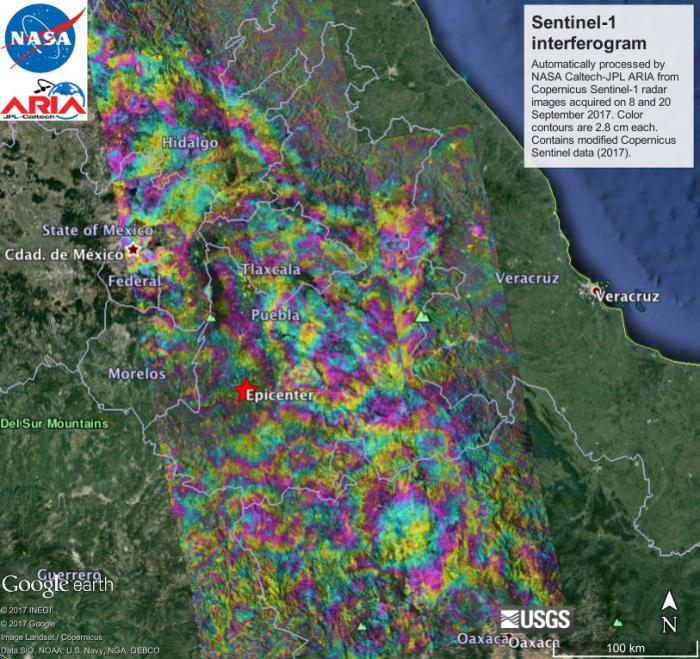
Scientists with the Advanced Rapid Imaging and Analysis project (ARIA), a collaboration between NASA's Jet Propulsion Laboratory, Pasadena, California, and the California Institute of Technology in Pasadena, analyzed interferometric synthetic aperture radar images from the radar instrument on the Copernicus Sentinel-1A and Sentinel-1B satellites, operated by the European Space Agency (ESA), to calculate a map of the deformation of Earth's surface caused by the quake. This false-color map shows the amount of permanent surface movement caused almost entirely by the earthquake, as viewed by the satellite, during a 12-day interval between radar images acquired by the two Sentinel-1 satellites on September 8 and September 20, 2017. This preliminary map came from automatic processing by the ARIA system.
In the map, surface displacements are seen as color contours, where each color cycle represents 1.1 inches (2.8 centimeters) of surface motion. The contours show there was broad deformation at the surface around 1-2 inches (3-5 cm) and there were no major surface ruptures due to the earthquake at 30 miles (50 km) depth. There are effects from variations in the atmosphere that cause contours not from ground deformation in many areas. Areas without the color contours are open water or heavy vegetation that prevents the radar measurements from measuring change between satellite images. Scientists use these maps to build detailed models of the fault slip at depth and associated land movements to better understand the impact on future earthquake activity. The red star shows the location of the earthquake epicenter estimated by the US Geological Survey (USGS) National Earthquake Information Center. The background image is from Google Earth.
Map contains modified Copernicus Sentinel data 2017, processed by ESA and analyzed by NASA-JPL/Caltech ARIA team. This research was carried out at the Jet Propulsion Laboratory, California Institute of Technology, under contract with the National Aeronautics and Space Administration. Sentinel-1 data were accessed through the Copernicus Open Access Hub.