With its rolling Black Hills and Badlands National Park, South Dakota isn’t a place most would associate with something more common in tropical climates. But South Dakota has the highest incidence of West Nile virus (WNV) of any state in the country, according to Lon Kightlinger, a retired epidemiologist from the South Dakota Department of Health.
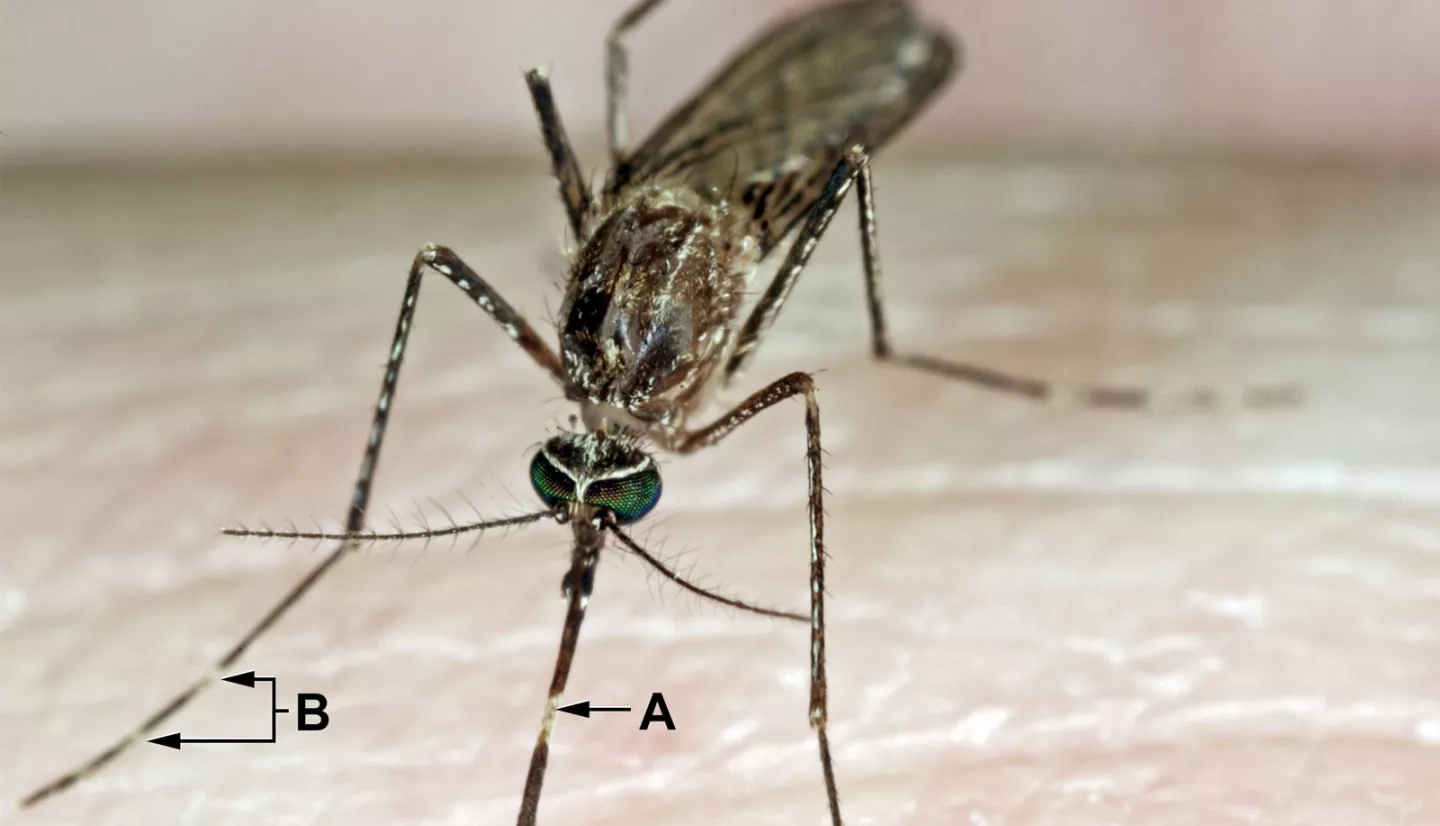
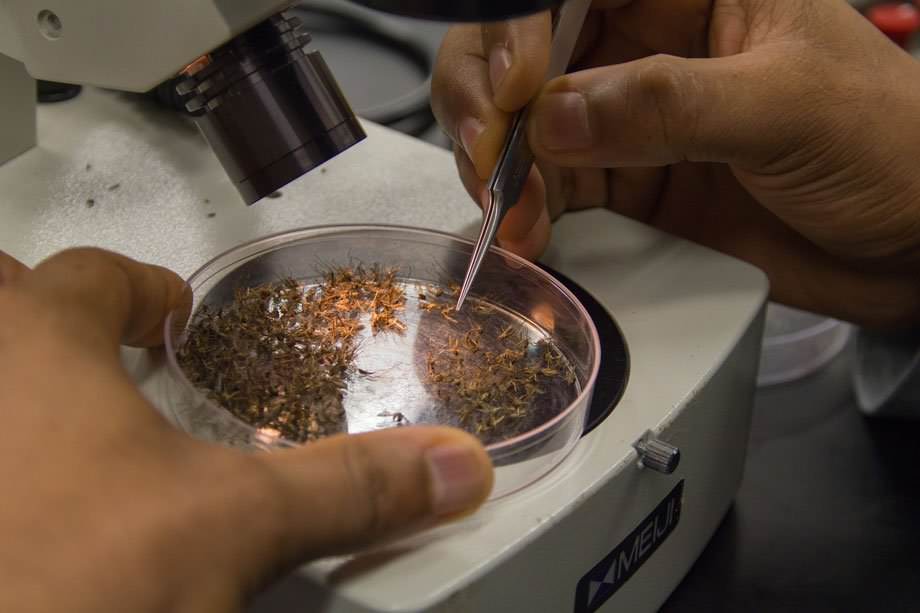
To predict a population’s risk of WNV, public health officials need to trap mosquitoes and test them for the virus. In a large, sparsely populated state like South Dakota, though, setting enough traps and gathering the needed data can be extremely time consuming and costly. To help fill those gaps between traps, a NASA Earth Applied Sciences team partnered with local health officials and South Dakota State University (SDSU) to use Earth-observing data for improved WNV forecasts.
A mosquito-borne infection first identified in Uganda nearly 80 years ago, WNV was first reported in the United States in 1999. Fortunately, WNV generally causes few, if any, problems for most people. For some, general flu-like symptoms arise and then clear up after a few days. For about 1% of the population, however, it can be debilitating or deadly.
“It’s a bird disease, but it can cause acute illness in people … It can put people in the hospital,” explained Kightlinger. South Dakota has been hit particularly hard, with more than 2,200 cases since 1999 – the most per capita in the United States. “It’s killed 35 people in South Dakota already,” Kightlinger added.
“We came up with some new ideas for how to develop an improved system for forecasting West Nile virus, leveraging information in satellite imagery,” said Michael Wimberly, a landscape ecologist from SDSU. “The major goal of our project is to develop a dynamic risk-mapping approach for West Nile virus [that] can actually be applied to do a better job of disease prevention and mosquito control.”
“The approach that we’re using for this project is [to] look at correlations between the years that have a lot of transmission of West Nile, versus low transmission, and correlating that to environmental data that’s coming from the satellite imaging,” said Michael Hildreth, a zoonotic parasitologist from SDSU. “We’re looking for predictive patterns, much like the weather forecasters are doing.”
One environmental factor that plays a key role in WNV transmission is temperature. “Mosquitoes are tiny, cold-blooded organisms and, as a result, all of the processes associated with mosquitoes are strongly influenced by temperature,” noted Wimberly.
Kightlinger added, “The information that we’re getting from the project are maps of risk factors associated with things that we, at the health department, really can’t track or figure out. Things that have to do with climate, lay of the land and precipitation … I think this will be absolutely an essential tool in controlling West Nile here in South Dakota.”
“We came up with some new ideas for how to develop an improved system for forecasting West Nile virus, leveraging information in satellite imagery.”
–Michael Wimberly, South Dakota State University
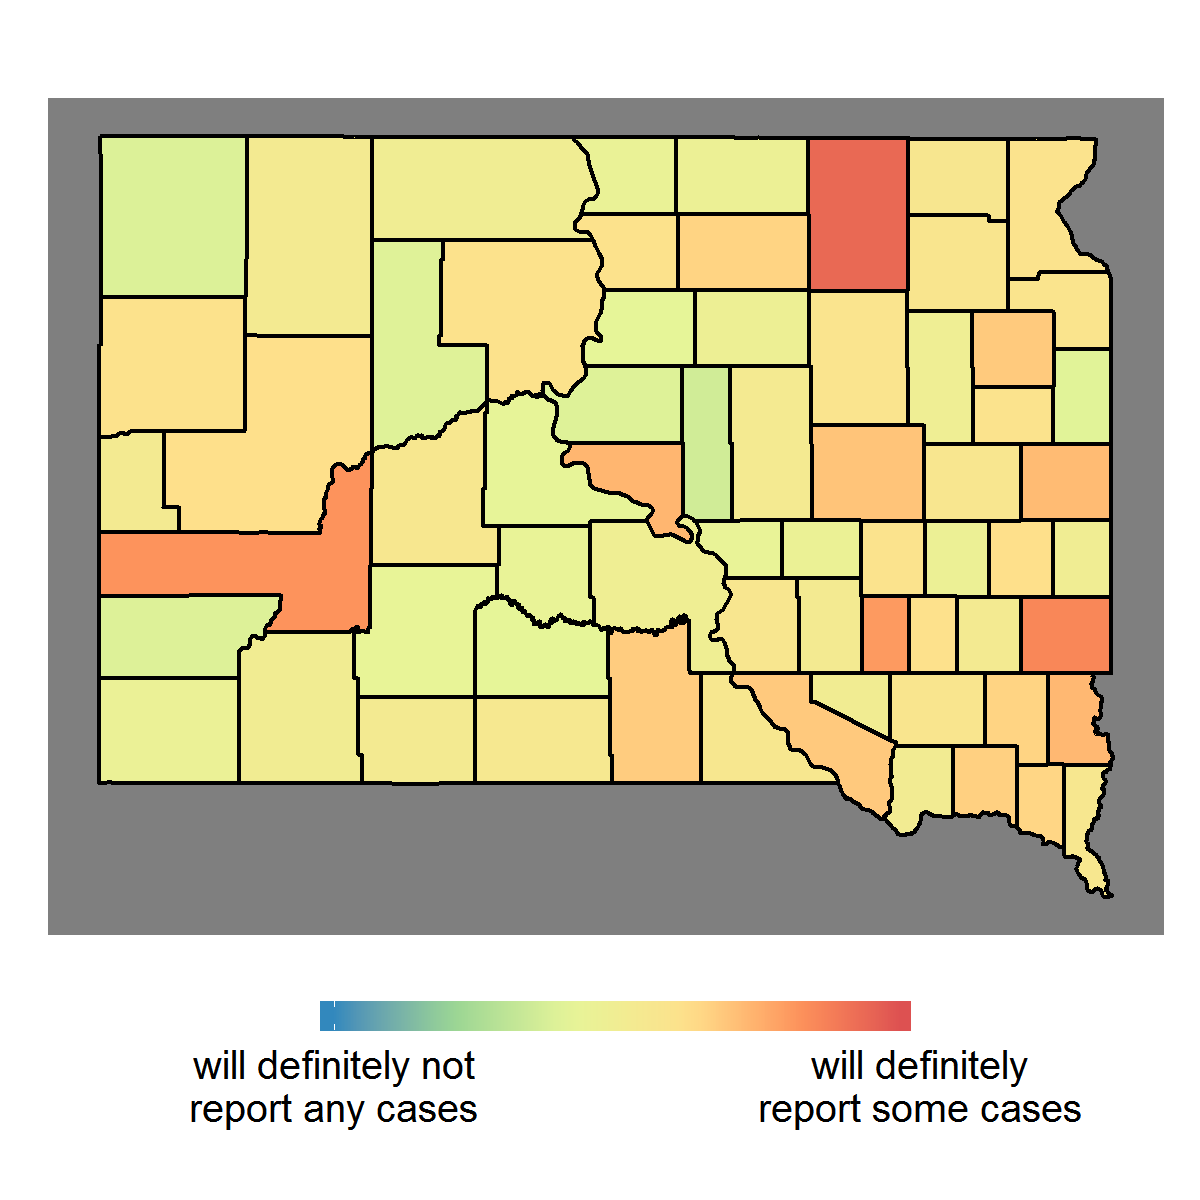
With this new data, SDSU now publishes an online weekly WNV risk assessment on its Mosquito Information Systems website, which includes a map of the risk for each county in South Dakota. SDSU also transferred its WNV forecasting tools to the South Dakota Department of Health, which features the weekly assessment in the “Know Your Risk” section of its website.
These reports now help South Dakotans see when and where their chances for contracting the disease are highest – information they couldn’t get in the past. “This project has gone from basic research to empowering communities, which are now vested in combating West Nile virus,” Hildreth said.
Kightlinger agreed and noted that the West Nile-NASA project is the first project he’s been involved with “where we’ve seen a practical use for using our … disease data correlating with the NASA environmental and climatological data. … [We now have] some good predictors of a disease that’s hurting and killing people in this state.”
This story is part of our Space for U.S. collection. To learn how NASA data are being used in your state, please visit nasa.gov/spaceforus.