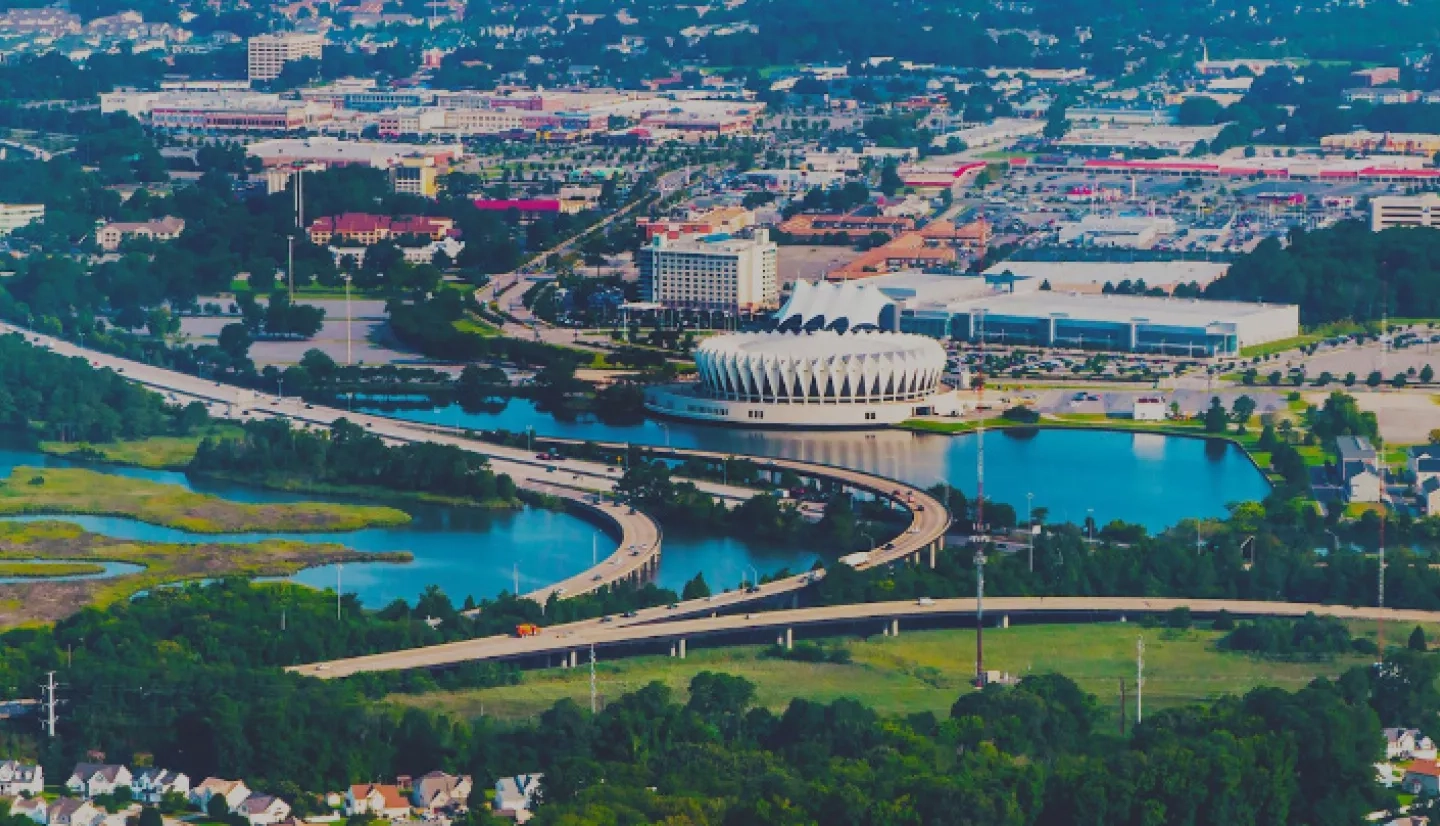
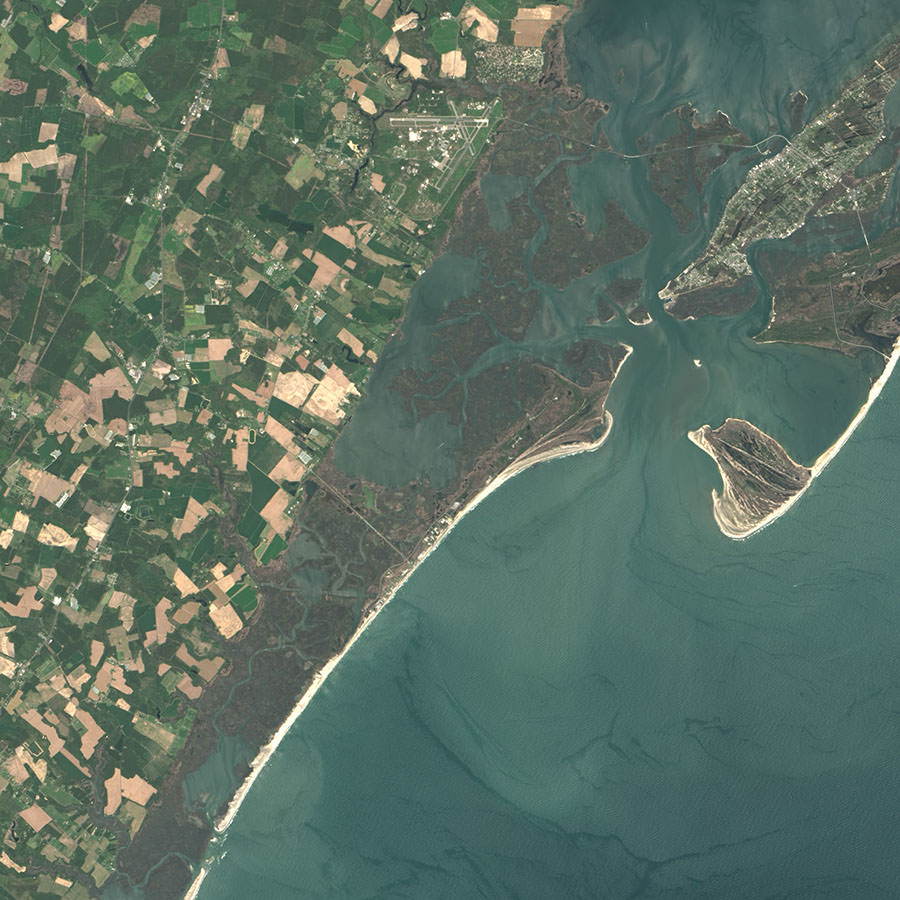
Beaches and parks along that shoreline remain a staple of Virginia’s tourism business – 19 million people visited Virginia Beach alone in 2017. But the Tidewater region is seeing an influx not of tourists, but of coastal flooding from rising seas. The Hampton Roads area – which includes Virginia Beach, Norfolk, Newport News, and other municipalities in southeastern Virginia and northeastern North Carolina – has been exceptionally vulnerable.
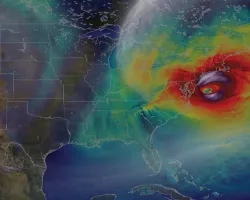
NASA used a satellite reanalysis of Hurricane Irene to better understand current and future flood threats, so city planners and emergency managers can map out various flood scenarios and make infrastructure plans accordingly.
“The entire Hampton Roads region is the most at-risk region on the East Coast for sea-level rise,” said Meg Pittenger, floodplain manager for the City of Portsmouth, Virginia.
Just across the Elizabeth River from Portsmouth, Kyle Spencer is the deputy resilience officer for the City of Norfolk. He too has seen the combination of rising seas and sinking land increasingly take its toll on the city and the surrounding region. “Norfolk is seeing an acceleration of relative sea-level rise,” he said.
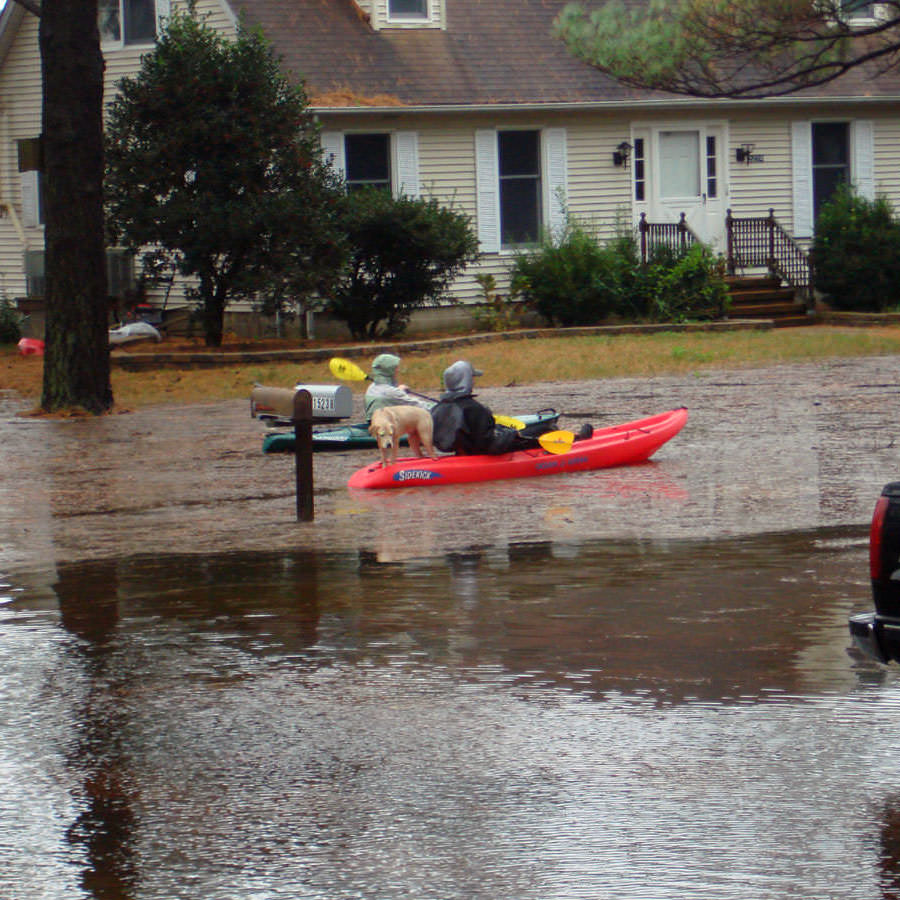
The main impact from this rise has been more frequent and severe coastal flooding. This is made worse during times of coastal storms and tropical cyclones – such as 2011’s Hurricane Irene, which produced a 7-foot (2.1 meter) storm surge in some locations.
“Some of the other things we are dealing with include erosion of our shorelines, sea walls and roads needing to be raised, backflow in stormwater drainage outlets, and increasing our design elevations for infrastructure,” Spencer added.
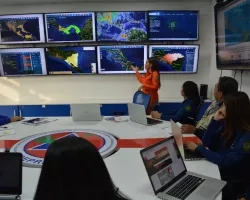
In 2017, NASA’s Disasters Program initiated a project called Communities and Areas at Intensive Risk (CAIR). CAIR’s goal has been to reduce disaster risk and build community resilience around the globe. One of CAIR’s domestic partnerships, the Mid-Atlantic CAIR Demonstration Project, focused on the resiliency of the Hampton Roads region. Derek Loftis, an assistant research scientist at the Virginia Institute of Marine Science, is its principal investigator.
“This project aimed to achieve a better understanding of current and future flood threats through reanalysis of a recent past storm – Hurricane Irene. It also aimed to research the impact of a similar-strength storm surge in the future,” Loftis said.
Loftis, along with several teams of scientists, collaborated to create model simulations of the weather and coastal flooding in Hampton Roads caused by Irene. Then the teams brought Earth-observing data into the mix to assist in validating the simulations.
“These remote-sensing resources aid in better understanding flood extents during and after a storm event,” noted Loftis. “The remote-sensing teams on this project identified [satellite] products that were capable of assessing flooding and residual ponding of rainfall after the storm.”
“Tide gauges and subsidence monitors can’t give us the full picture in Portsmouth. Remote-sensing data allows us to monitor and assess many more points of concern that are potentially impacted by a host of unique conditions.”
–Meg Pittenger, City of Portsmouth
By integrating the Irene simulations with Earth-observing data and imagery, Loftis and his teams developed a new, high-resolution flood tool called the “street-level model.” The model allows users to track the relative sea-level rise expected throughout Hampton Roads through 2045 and can simulate the effects of another “Irene” under those changing conditions. With this model, city planners and emergency managers can pinpoint various flood scenarios – down to the building level.
“We have been using the street-level flood model to inform decisions we make around long-term planning and design efforts for larger-scale projects – whole blocks and neighborhoods – and also for emergency operations planning and alerts,” Spencer said. “One of the things we have in the works is identifying flood-prone roads and intersections we can target for deploying water-level sensors. The data from these sensors can be fed back into this model, and are also used to inform our own stormwater network modeling and road improvements plans.”
In Portsmouth, Pittenger is using the model as preliminary guidance for the city’s future infrastructure plan, Build One Portsmouth, and its Joint Land Use Study. “We are working with the Navy, in part, to analyze current and future commuting problems for people attempting to access the Norfolk Naval Shipyard, the Naval Hospital, and the Navy’s Craney Island facility,” Pittenger said.
“Tide gauges and subsidence monitors can’t give us the full picture in Portsmouth,” she added. “Remote-sensing data allows us to monitor and assess many more points of concern that are potentially impacted by a host of unique conditions … It is important for us to understand exactly why a specific point is flooding and how bad that flooding is.”
This story is part of our Space for U.S. collection. To learn how NASA data are being used in your state, please visit nasa.gov/spaceforus.