The beautifully rugged Grand Canyon State stretches 389 miles (626.04 kilometers) from Mexico to Utah and boasts five different climate zones – including subarctic conditions along its highest peaks. But Arizona is perhaps best known for its hot and sunny disposition.
That climate comes with a price, and residents of Arizona’s “Sun Corridor,” which runs from Phoenix to Tucson, know this all too well. It’s not only one of the nation’s hottest and sunniest regions, but it’s also seeing a boom in population and urbanization, a combination that can elevate heat waves to health emergencies. Thousands of Arizona residents visit emergency rooms because of the heat annually – and in Maricopa County, heat-related illnesses kill more than 100 people every year.
“Heat is a chronic problem here in Phoenix,” said Kate Goodin, the epidemiology and data services program manager at the Maricopa County Department of Public Health (MCDPH). “The subtlety of exposure to high heat is a challenge in both messaging, as well as getting people to pay attention and take action.”
Historically, the people most vulnerable to extreme heat include children, elderly, homeless, economically disadvantaged, and socially isolated populations. In those communities, the locations of highest concern include homes with no air conditioning or those that forgo air conditioning for economic reasons. Compounding the problem is that as the Phoenix metropolitan population grows, the increase in urban structures raises nighttime temperatures, creating an urban “heat island” (UHI) effect.
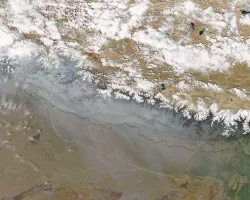
MCDPH and Arizona State University teamed with NASA DEVELOP in the Earth Applied Sciences Program, to help the most at-risk populations by establishing a more effective method of placing hydration and cooling centers around Maricopa County and enhancing the county’s heat warning system. Combining satellite data and images, the team measured the daily variability of the summer UHI across Maricopa County from 2005 through 2014. This allowed the team to establish a temperature history and identify the spatial pattern of extreme heat.
“We were able to determine that, although daytime temperatures start to decline in the late-summer season, there is a lag with nighttime temperatures, where heat is being held in by impermeable surfaces like concrete or asphalt,” explained Principal Investigator Amy Stuyvesant, who was then NASA’s GIS project manager for Arizona Health & Air Quality. “This means Maricopa County residents are not receiving the heat relief they need at night, even though temperatures are starting to decline during the day.”
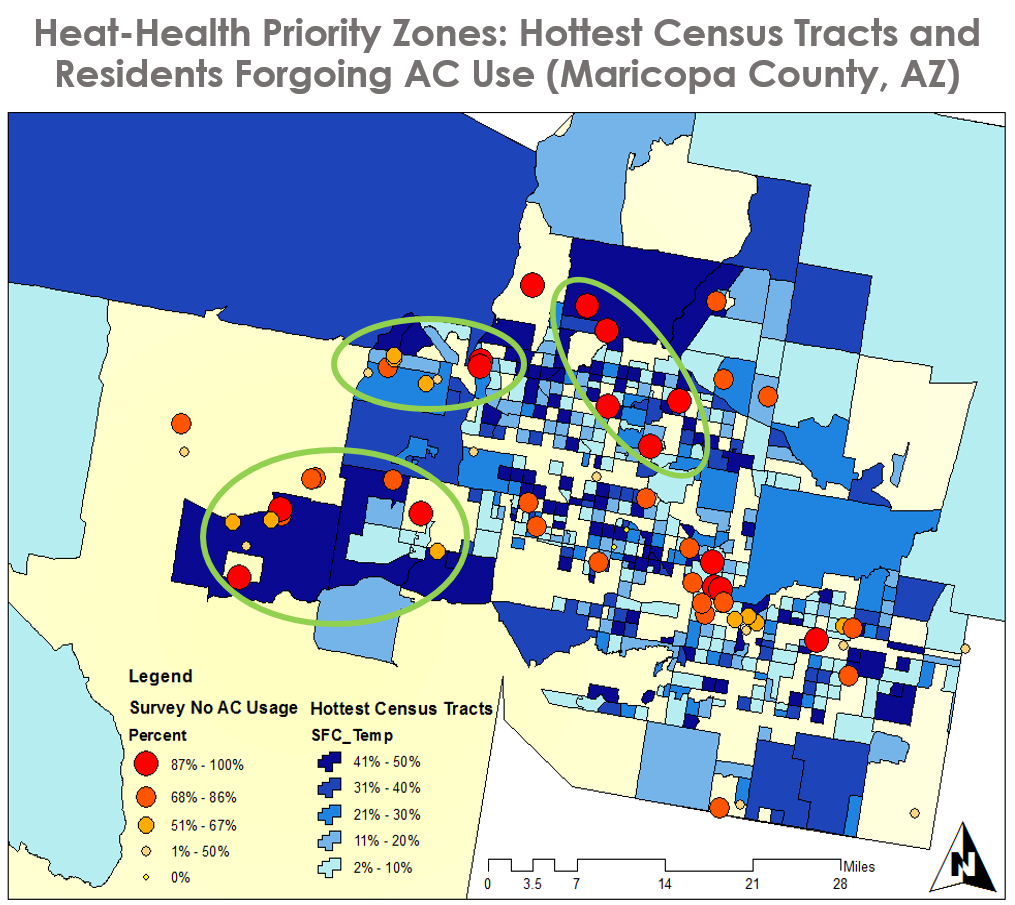
The team’s data showed that neighborhoods in the West Valley region were consistently among the hottest locations throughout the summer season. These locations also coincided with the highest percentage of residents who reported going without air conditioning due to the high cost.
“The data generated by the project have been used by several MCDPH partners … [who] are using the thermal imagery … as guidance in determining specific communities where cooling and social service efforts are expected to be implemented.”
–David Hondula, Arizona State University
“The data generated by the project have been used by several MCDPH partners for program guidance, including the City of Phoenix in its ‘Cooler Phoenix’ initiative and The Nature Conservancy in its ‘Nature's Cooling Strategies’ project,” remarked David Hondula, project partner and assistant professor at Arizona State University’s School of Geographic Science and Urban Planning. “Both entities are using the thermal imagery developed in the project as guidance in determining specific communities where cooling and social service efforts are expected to be implemented over the next several years.”
This DEVELOP project is just one example of how Arizona officials are utilizing NASA satellite data and imagery for heat mitigation and adaptation strategies. As Hondula explained, “Communities in Maricopa County are beginning to propose and implement rigorous urban tree canopy plans and goals as a means of keeping residents cool and comfortable in the summer months.” So as metro Phoenix continues to heat up, NASA Earth observations are helping residents find ways to stay cool.
This story is part of our Space for U.S. collection. To learn how NASA data are being used in your state, please visit nasa.gov/spaceforus.