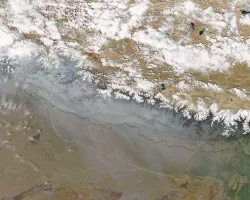
Any New Yorker knows that summer in the Empire State can get heated. The highest temperature on record for New York, set in 1926 in Troy, is 108° F (42.2° C). Research conducted by NASA, the National Oceanic and Atmospheric Administration (NOAA), and the New York State Department of Health (NYSDOH), found that heat-related illness in the state occurred at lower temperatures than previously thought.
At the start of summer 2018, the National Weather Service (NWS) office in New York officially lowered the heat advisory threshold for the state from 100° F (37.8° C) to 95° F (35° C). The NWS issues a heat advisory when hot temperatures and high humidity – called the heat index or “feels-like” temperature – combine to create a situation where heat illnesses are possible.
“The New York State health research indicates that New Yorkers are not used to long periods of heat,” said Gary Holmes, spokesperson for NYSDOH. “They may get sick at lower temperatures than people in traditionally hotter parts of the country.”
NASA Earth Science’s Health and Air Quality Applied Sciences Team (HAQAST) began the study to determine when high temperatures in New York State started to negatively affect human health – but first, the project team needed more complete data.
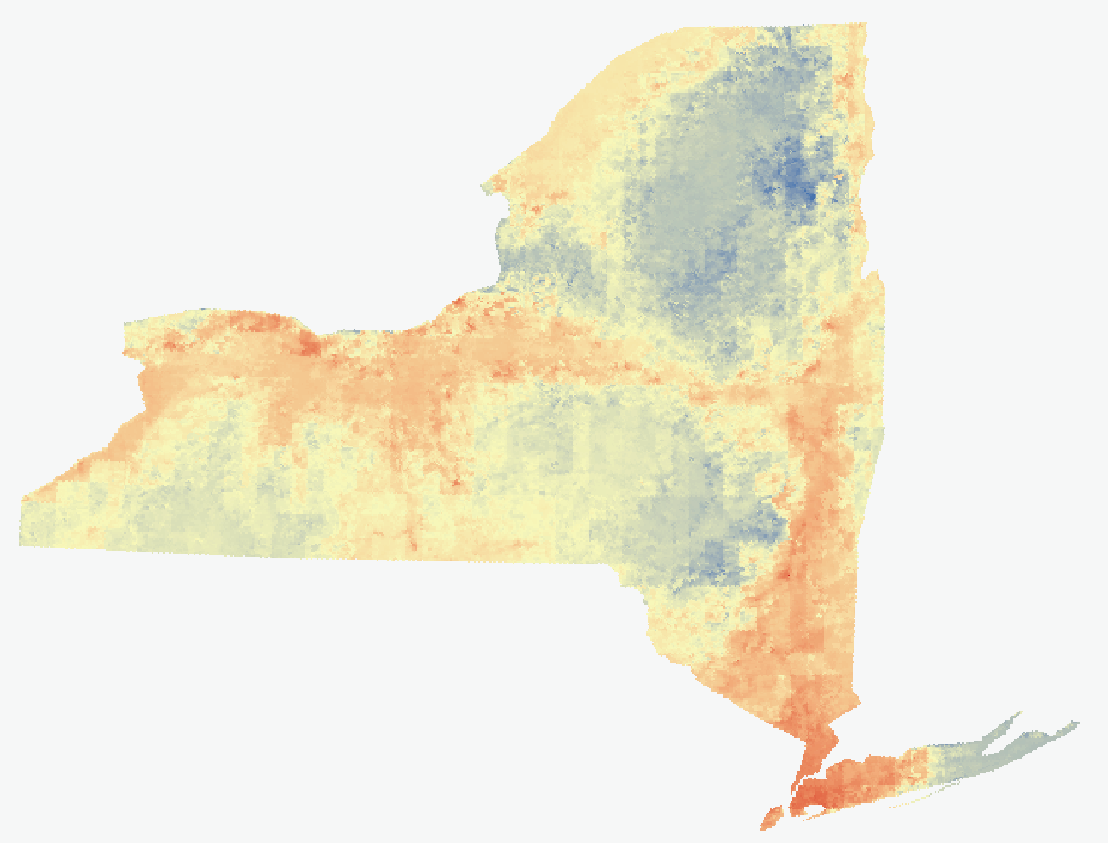
“We weren’t able to get a good estimate of the health effects of climate at a small scale [1 square kilometer] from the sparse climate-monitoring data across New York State,” said Tabassum Insaf, the acting research director at NYSDOH’s Bureau of Environmental and Occupational Epidemiology.
As principal investigator of this project, Insaf turned to partners affiliated with NASA’s Marshall Space Flight Center to acquire North American Land Data Assimilation System (NLDAS) information to fill in the missing gaps. NLDAS uses a combination of surface-based data, predictive models, and satellite observations from NOAA and NASA, to produce more accurate data analysis and forecast simulations.
Insaf and her team reviewed NLDAS temperature data showing threshold values of maximum temperatures, average temperatures, minimum temperatures and maximum heat index. Then, they compared those data to New York State health data.
“Now we will be issuing heat-related advisories based on science-based temperature, health and hospital-visit data … The [NLDAS] satellite data was vital to the study of temperature and apparent temperature data that supported the lowering of the Heat Advisory criteria.”
–Neil Stuart, National Weather Service
“We looked at daily admissions and emergency department visits for a period of five years and we correlated that with the temperature data on the days that people experienced ailments such as heat stress, dehydration, respiratory and cardiovascular illness, and reduced renal function,” Insaf noted.
The results showed that New York State’s threshold for alerting the public to extreme heat needed updating. “Our research found that the health effects associated with temperature in our region actually occurred at lower temperatures than the National Weather Service criteria, which were based on studies in hotter areas of the U.S.,” Insaf explained. “We worked with the local National Weather Service … and they were very receptive to our research.”
Neil Stuart, lead meteorologist for the National Weather Service Forecast Office in Albany, New York, agreed with Insaf and added, “The criteria for heat-related advisories had been in place for over 20 years and was based on coordinating with partners regarding frequency of heat events. Now we will be issuing heat-related advisories based on science-based temperature, health and hospital-visit data … The satellite data was vital to the study of temperature and apparent temperature data that supported the lowering of the Heat Advisory criteria.”
The project’s research has also led to the development of the state Department of Health’s County Heat and Health Profile Reports, which describe county-specific temperature trends, summarize heat-related health effects, identify areas with populations at highest vulnerability to heat, and list some available adaptation resources. “The County Heat and Health Profiles can help communities prepare for and prevent heat-related illness,” Holmes emphasized.
This story is part of our Space for U.S. collection. To learn how NASA data are being used in your state, please visit nasa.gov/spaceforus.