Spaceborne data are monitoring these airborne assailants in the name of public health.
It’s a simple tactic in mosquito combat—find out where the little bloodsuckers are headed and cut them off at the pass. An online system is using NASA data to do just that.
Cyber (Mosquito) Warfare
When California public health agencies need to stop a flying menace, they turn to an online weapon first.
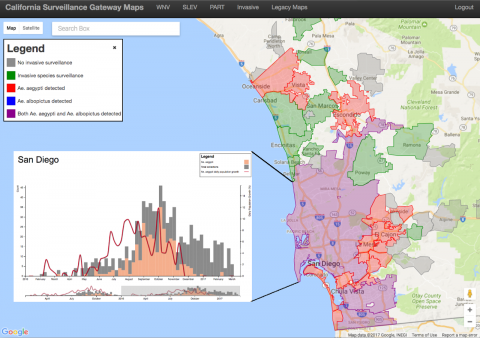
 Called the California Vectorborne Disease Surveillance Gateway, or CalSurv Gateway, this decision support system acts as a central repository for crucial mosquito information. For example, control agencies can input and share surveillance data detailing where potential disease-carrying mosquitoes have been collected in traps. And thanks to Earth-observation data, they can also access maps that highlight which communities are the most susceptible to the next mosquito invasion.
“Models based on NASA data have been a valuable complement to California’s decision support system for mosquito-borne viruses for more than a decade,” said Chris Barker, an associate professor of epidemiology at the University of California, Davis. “The CalSurv Gateway was originally developed with support from NASA and NOAA to address West Nile virus.” Recently though, Barker has been leading an Applied Sciences project that’s enhancing CalSurv’s database for invasive mosquitoes, specifically Aedes albopictus and Aedes aegypti.
These mosquitoes are bringing a new crop of disease threats to the U.S. and Golden State.
Where Are They Going?
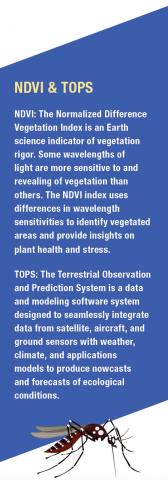
Barker’s project focused on using Earth observations to help control agencies stay one step ahead of these non-native pests. Once an agency enters its Aedes mosquito collection data into the CalSurv Gateway, the data is then integrated into a model that helps predict where they will likely go next—depending on a location’s suitability. To determine that, CalSurv uses a mosquito habitat model from NASA’s Earth Exchange computing platform that integrates land-surface temperature data from NASA TOPS and airborne NDVI data. From that, the system creates distribution and suitability maps.

CalSurv’s data and maps allow control agencies to focus surveillance and control efforts in the right places from the start. “Early detection of new infestations is critical because it gives a much better chance for eliminating the mosquitoes locally,” Barker emphasized. “Once the mosquitoes have become widespread, elimination becomes a very difficult proposition.”
“Mosquito reproduction is strongly influenced by temperature and water availability, and NASA Earth observations link these physical processes to the biological parameters… This helps to optimize our surveillance and control programs by targeting efforts in critical areas.” California Department of Public Health
The project’s maps are an important guide to Paula Macedo, the laboratory director of Sacramento-Yolo Mosquito & Vector Control. She explained, “The estimated spread/distribution information on the CalSurv Gateway predicted that our service area is suitable for invasive Aedes species. The maps have helped us determine the ideal timing for initiating and terminating surveillance and have helped us better target our efforts.”
Zika Emerges
For the first two years of Barker’s project, there were two diseases that Aedes mosquitoes were notorious for carrying. “At that time, Dengue and Chikungunya virus were the chief concerns,” Barker noted. Then came Zika.
“In 2016, the project expanded to include Zika virus since it emerged as a global health threat,” Barker said. This new threat spurred Barker and his team to develop local guidance maps for the seasonal patterns of the Aedes mosquitoes’ population growth, which were also added to CalSurv Gateway late in 2016.
 This addition is now part of the arsenal of maps and charts Susanne Kluh and her team use for their surveillance decisions. Kluh, the scientific-technical director at Greater Los Angeles County Vector Control, knows the challenges her agency faces. “Mosquitoes with the potential for carrying Zika are already present in Southern California and they are also spreading as we speak,” she stressed. “The possibility for Zika, or any of the other invasive Aedes transmitted diseases, to be spread locally in the near future is thus not a far stretch.”
That possibility drove the project’s recent urgency to provide more maps and data in CalSurv. “Now our models are beginning to allow us to test ‘what-if’ scenarios and optimize surveillance and control strategies in ways that would never be possible with field data collection alone,” Barker said.
Buzzing Along
What’s next for the project? Along with the Aedes maps already in CalSurv, Barker’s team has been working to include maps that show the estimated risk for contracting Zika itself. For that, Barker will need to determine and integrate mosquito abundance. “When you collect these mosquitoes, it’s not so easy to know how many you have in a given area,” Barker said. “Our estimates for Zika virus risk will be based on a model for transmission that accounts for local temperatures and mosquito abundance in each city.” Barker expects the risk maps to be online by spring of 2017.
That information will be critical for Kluh’s agency. She fears that the region’s large, diverse, and well-traveled population could make it easy for anyone to bring Zika to the nation’s secondlargest city. “The capability of modeling likely outbreak scenarios is going to be of great value in the attempt to best use our limited resources to get and stay ahead of the disease.”
Chris Barker leads this project.


