Displaying 1 - 10 of 14
Ecological Conservation
Health & Air Quality
![This image depicts chlorophyll-a concentrations along the Southern California Coast during a Harmful Algae Bloom, also known as a Red Tide Event. The ocean imagery was taken in April of 2020 by Aqua MODIS and used to generate chlorophyll-a concentration. The land imagery was taken by Sentinel-2 MSI during the same time period, and a Normalized Difference Chlorophyll Index was applied to it for visualization purposes. Blue and green indicates high and low chlorophyll-a concentrations, respectively. On land,](/sites/default/files/styles/lis/public/2022-05/2021Fall_ARC_SoCalHAQ_WebImage.png.webp?itok=1m8SL35K)
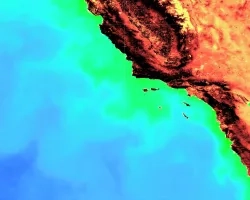
Southern California Health & Air Quality (Fall 2021) Team: Michael Enz (Project Lead), Melanie Leung, Maya Zimmerman, Jonathan Van Dermark, and Petra Nichols Summary: In...
![The difference in Aerosol Optical Depth (AOD) between ozone spike days in summer 2018 and 2020 in Seiling, Oklahoma. AOD measures particles distributed within a column of air and can help predict tropospheric ozone spikes and inform regulatory organizations. Data derived from Terra and Aqua MODIS with 2020 Landsat 8 imagery as a base map. Yellow represents the greatest difference in AOD and purple represents the least difference, with green in the middle. Areas with negative values were removed.](/sites/default/files/styles/lis/public/2022-03/2021Fall_JPL_OklahomaHealthAndAirQuality_WebsiteImage.jpg.webp?itok=PR2zL79Y)
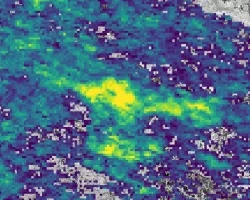
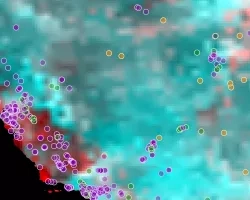
Oklahoma Heath & Air Quality (Fall 2021) Team: Carolina Rosales (Project Lead), Robert Alward, Kjirsten Coleman, Katherine Howell, and Vanessa Machuca Summary: Tropospheric ozone (O3)...
![Oversampled nitrogen dioxide (NO2) atmospheric column data from select months (May – September) in 2019 derived from the OMI sensor aboard the NASA Aura satellite. The darker purple colors reflect lower concentrations of NO2 in our study region, but as the color scale moves towards brighter yellow it represents high concentrations of NO2. Assessing the NO2 gas distribution, in addition to other gases, can aid project partners in identifying hotspots of emissions.](/sites/default/files/styles/lis/public/2022-03/2021Fall_LaRC_SoutheastMichiganNorthernOhioHealthandAirQuality_WebsiteImage.png.webp?itok=-X50Y6mw)
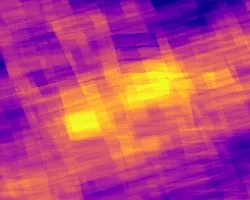
Southeast Michigan Health & Air Quality (Fall 2021) Team: Mariam Moeen (Project Lead), Helen Turvene, Yuan Lin, and Albert Kodua Summary: Pollutants resulting from industrial...
![2022 Spring JPL GM Health AQ Website Image](/sites/default/files/styles/lis/public/2022-06/2022Spring_JPL_GMHealthAQ_WebsiteImage.png.webp?itok=wOSOwYFt)
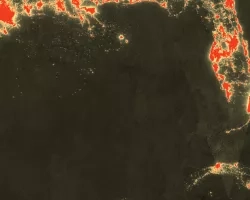
Gulf of Mexico Health & Air Quality (Spring 2022) Team: Kate Howell (Project Lead), Ashley Fernando, Ephrata Yohannes, J. Kyle Bergerson Summary: The extraction, production...
![2022 Spring LaRC Delaware Basin Health AQ Website Image](/sites/default/files/styles/lis/public/2022-06/2022Spring_LaRC_DelewareBasinHealthHAQ_WebsiteImage_v2.png.webp?itok=NQ14xvAW)
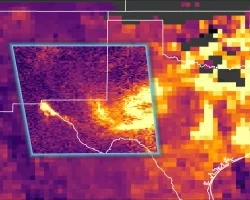
Delaware Basin Health and Air Quality (Spring 2022) Team: Sean Cusick (Project Lead), Amber Schlessiger, Billy Henshaw, Perrin Krisko Summary: Nitrogen dioxide (NO2) is a...
![2022 Spring VEJ Needs Assessment Health AQ Website Image](/sites/default/files/styles/lis/public/2022-06/2022Spring_VEJ_NeedsAssessmentHealthAQ_WebsiteImage_v4.png.webp?itok=J-RFJY8B)
Environmental Justice Needs Assessment for Health & Air Quality (Spring 2022) Team: Elizabeth Duran (Project Lead), Paige Aldenberg, Sadie Murray, Thomas Schindelman Summary: Health and...
![Google Earth Engine processed off-shore imagery in the Gulf of Mexico. The image was captured by NASA Earth observations satellite Landsat 9 OLI on March 9, 2022. Colors correspond to fractional reflectance values derived from a multi-band-multi-pass method for detecting methane absorption across bands 6 and 7.](/sites/default/files/styles/lis/public/2023-02/2022Fall_JPL_GMHAQII_WebsiteImage.png.webp?itok=Waojjr-w)
Gulf of Mexico Health & Air Quality II (Fall 2022) Team: Ben Dahan (Project Lead), Melodi Hess, Rene Castillo, Vanessa Machuca Summary: Offshore oil and...
![Aerosol Optical Depth for a dust event on July 26th-27th, 2021, calculated with the MAIAC algorithm from Terra and Aqua MODIS satellite data. Great Salt Lake surface area, in blue, was derived from JRC Yearly Water Classification History and processed imagery from Landsat 5, 7, and 8. The map depicts regions that are most impacted by dust surrounding the Great Salt Lake. Red and Yellow represent high dust levels within Northern Utah.](/sites/default/files/styles/lis/public/2023-05/2023Spring_VEJ_GreatSaltLakeHAQ_WebImage.jpg.webp?itok=T6r5Pogy)
Topic
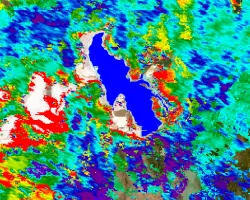
Great Salt Lake Health and Air Quality (2023 Spring) Team: Piper Christian (Project Lead), Fiona Summers, Yoana Vargas Magana, Andrea Delgado Summary: Water flow into...
![Aerosol optical depth concentration from MODIS, captured on August 16, 2020, during the fire season. Dark purples hues indicate normal atmospheric conditions, while orange and yellow hues show high concentrations of aerosols, suggesting the presence of smoke and particulate matter following a fire event. MODIS aerosol optical depth can be used as a proxy for PM2.5 pollution, increasing decision makers’ capacities to monitor and address the negative effects of wildfire smoke plumes on residential areas.](/sites/default/files/styles/lis/public/2023-05/2023Spring_LaRC_ColoradoSpringsHAQ_WebImage.png.webp?itok=rNvnSpEC)
Topic
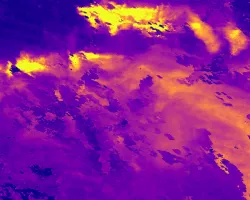
Colorado Springs Health and Air Quality (2023 Spring) Team: Olivia Etherton, Jeanette Moritz, Joshua Stokes, Ephrata Yohannes Summary: The City of Colorado Springs, situated in...