Displaying 1 - 2 of 2
![NDMI over a wildland urban interface in central Chile generated from Landsat 8 OLI median-reduced data from March 1, 2018 through February 28, 2022. Orange areas represent vegetated shrublands and forests with low moisture content and green areas representing vegetated agricultural areas with high moisture content. The NDMI was used as a proxy for wildfire fuel moisture in a wildfire risk assessment.](/sites/default/files/styles/lis/public/2022-12/2022Sum_LaRC_ChileWildfires_WebsiteImage_V2.jpg.webp?itok=YJDde00a)
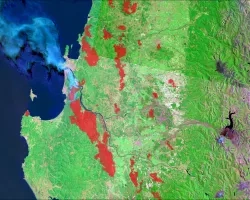
Chile Wildfires (Summer 2022) Team: Chris Matechik (Project Lead), Reuben Alter, Jennifer Ruiz, Stephen Sene Summary: In recent years, Central Chile has experienced wildfires of...
![The data come from Landsat 9 OLI and MODIS satellites. The data shows surface reflectance imagery and combined (Terra and Aqua) MODIS burned areas from wildland fires in February 2023. The image shows parts of South-Central Chile covering Región del Maule, Región del Bío-Bío, and Región de La Araucanía. The processed data show burned areas in the region of interest from wildland fires and the smog from the fires. Red patches indicate burned areas.](/sites/default/files/styles/lis/public/2024-01/2023Sum_PUP_ChileWildlandFires_WebsiteImage.jpg.webp?itok=M4LTKzkk)
Topic
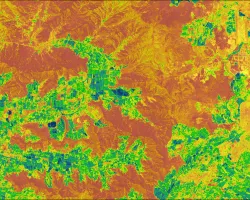
Chile Wildland Fires (Summer 2023) Team: Benjamin D. Goffin (Project Lead), Quinton Deppert, Aashutosh Aryal Summary: Since 2010, Central and South-Central Chile have recorded abnormally...