Displaying 51 - 53 of 53
![Kernel density distributions of census tract-level cooling degree days from May through September 2013 in Fahrenheit by race/ethnicity across the climate regions of New York State. Cooling degree days are calculated with a threshold of 65°. White = Non-Hispanic White, Hispanic = Hispanic/Latino of any race, Black = Non-Hispanic Black, Asian = Non-Hispanic Asian.](/sites/default/files/styles/lis/public/2023-10/Carrion%20Project%20Page%20Image.png.webp?itok=yyxxauFg)
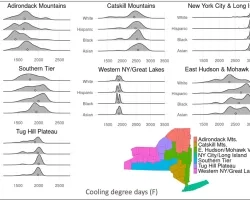
Identifying temperature disparities, energy insecurity, and social vulnerability for energy justice in New York State Team: Daniel Carrión (Yale School of Public Health), Anna Stouffer...
Applied Sciences
Capacity Building
Health & Air Quality
Prizes & Challenges
![This example map from Hang’s project indicates MODIS land surface temperature over selected underserved communities in Atlanta in early 2005. This map was co-designed by residents from those communities that are concerned about the seasonal change of extreme weather, air pollution, accessibility to green space such as parks and Atlanta BeltLine. (Credits: Ethan Li and Yun Hang, Emory University)](/sites/default/files/styles/lis/public/2024-04/Hang%20Project%20Page%20Image.png.webp?itok=7MiGgISi)
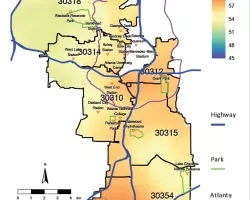
Team: Melanie Pearson (Emory University), Christine Ekenga (Emory University), Yang Liu (Emory University), Ethan Li (Emory University), Erin Lebow-Skelley (Emory University), Alina Merceron (Emory University)...