Imagen
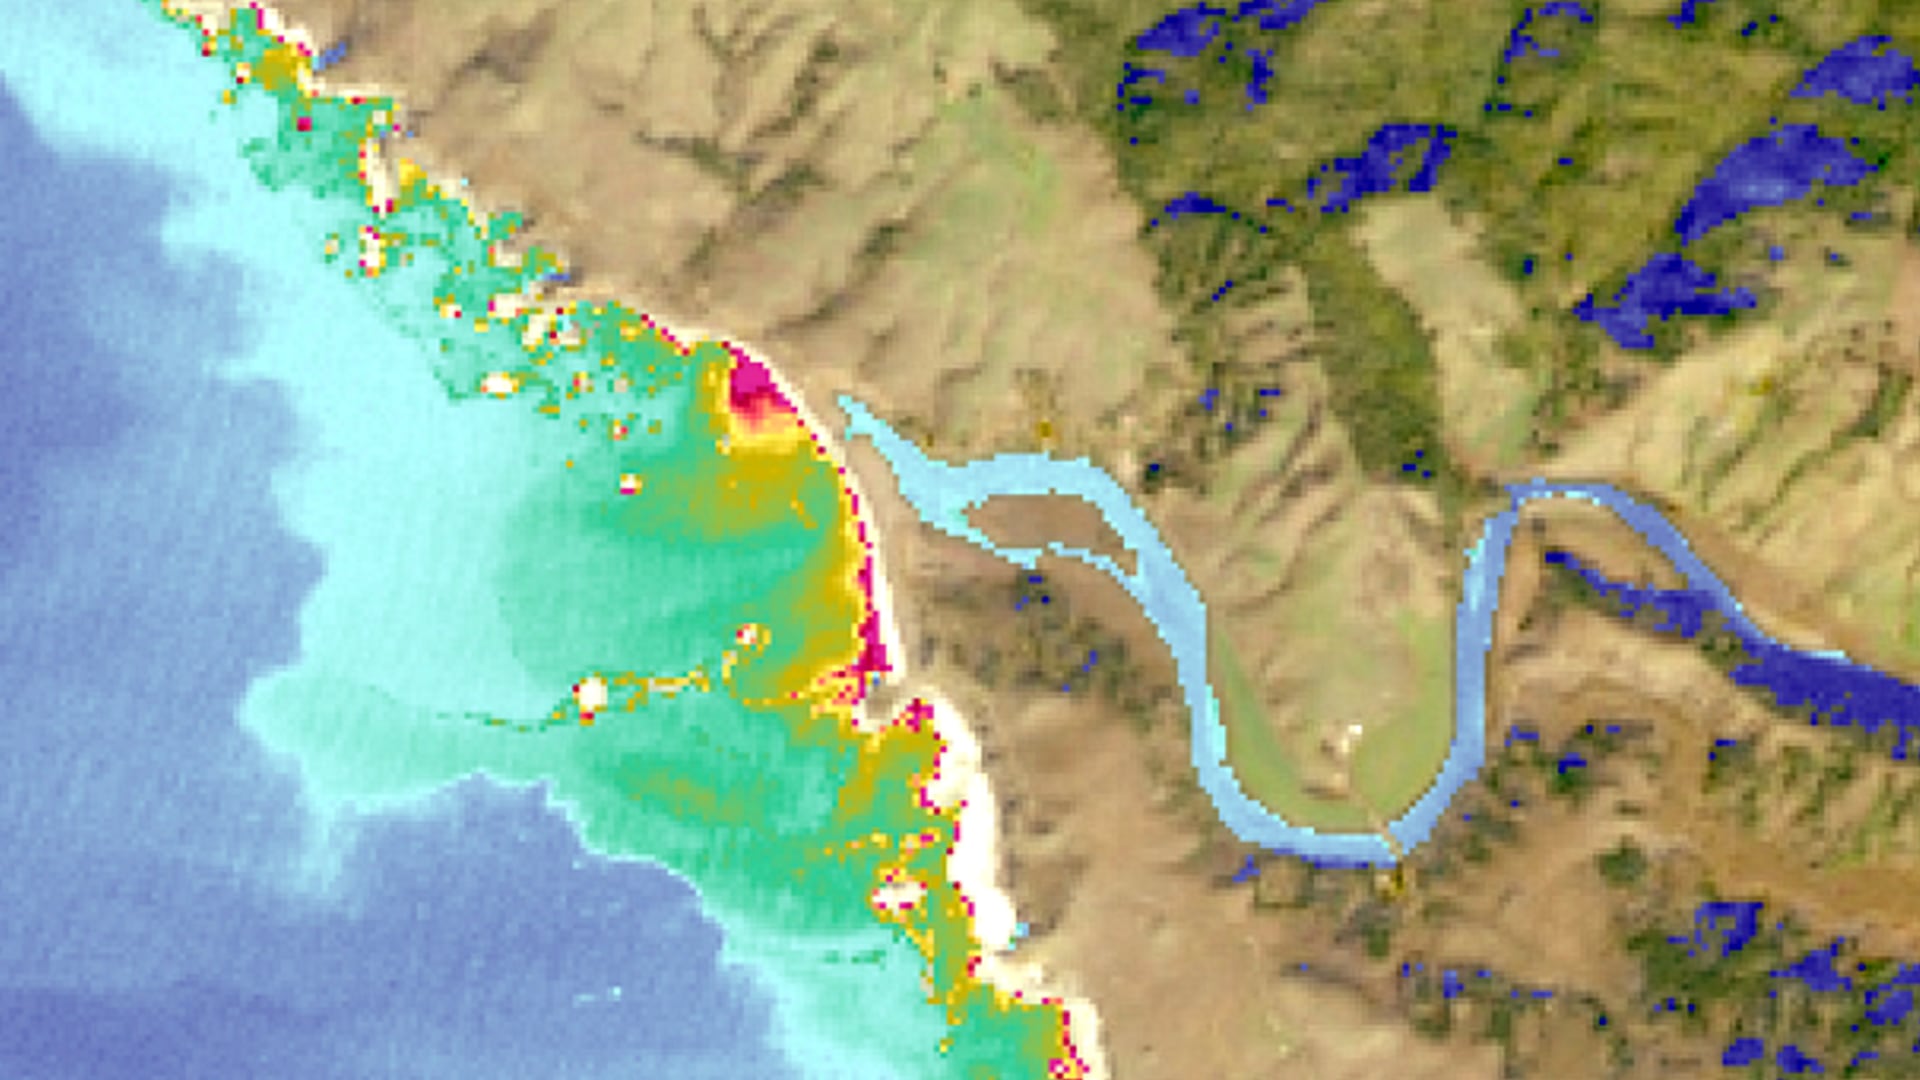

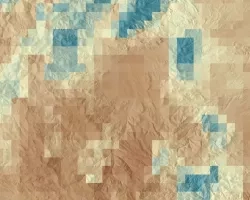
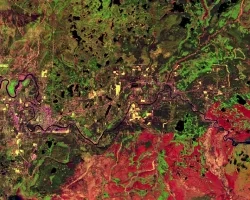
Estuaries are vital ecosystems that serve important ecological functions. The Marine Life Protection Act aims to protect these ecosystems by establishing a network of marine protected areas (MPAs), in part by requiring regulatory agencies to monitor estuary extent and health. However, California has 23 estuarine MPAs (EMPAs) and approximately 440,000 total acres of estuarine habitat, making ground-based data collection time and resource intensive. This project used remotely sensed data to examine the health of California EMPAs in an effort to supplement ground-based field measurements. Using Landsat 8 Operational Land Imager (OLI), Sentinel-2 MultiSpectral Instrument (MSI), and Sentinel-1 C-band Synthetic Aperture Radar (C-SAR), this project assessed mouth state, inundation extent, turbidity, Chlorophyll-a, and colored dissolved organic matter (CDOM) for estuaries observable with these sensors. Determining the Normalized Water Difference Index (NDWI) from Sentinel-2 MSI data captured estuary mouth state and inundation extent. Meanwhile, Landsat 8 OLI and Sentinel-2 MSI indicated a capacity to capture differences in water quality metrics coinciding with changes to estuary mouth state using algorithms applied in Google Earth Engine (GEE). The GEE California Estuary Assessment tools will allow project partners to better monitor and understand estuarine dynamics and health.