Team Members: Dr. Michelle Stuhlmacher (DePaul University), Dr. Winifred Curran (DePaul University), Dr. Marynia Kolak (University of Illinois, Urbana Champaign), Dajoin Williams (DePaul University), Christopher Impellizeri (DePaul University), Aisha Syed (University of Illinois, Urbana Champaign), Sparsh Singh (University of Illinois, Urbana Champaign), Dr. Christian Braneon (CUNY Institute for Demographic Research)
Executive Summary: This project expands the functionality of ChiVes, a Chicago-based, multi-institution open-source geospatial dashboard (https://chichives.com/). ChiVes integrates neighborhood-level information from Earth Observation (EO) data, environmental indicators, and socioeconomic factors to support green space planning and related decision-making processes in Pilsen, an environmental justice community. The project has four objectives: 1) Identify, construct, and integrate data products needed for community participatory processes. 2) Integrate and maintain EO, environmental, and socioeconomic indicators in an interactive web-based geospatial platform. 3) Add functionality to ChiVes that allows users to dynamically create customized indices. 4) Train residents on the tool and build capacity for ongoing use.
Objective 1: Collate and Calculate Variables. ChiVes has been expanded to include sixteen new variables that covered air quality, indicators of gentrification, and other data identified by our community partners. There are currently thirty-three datasets available in ChiVes for viewing and downloading.
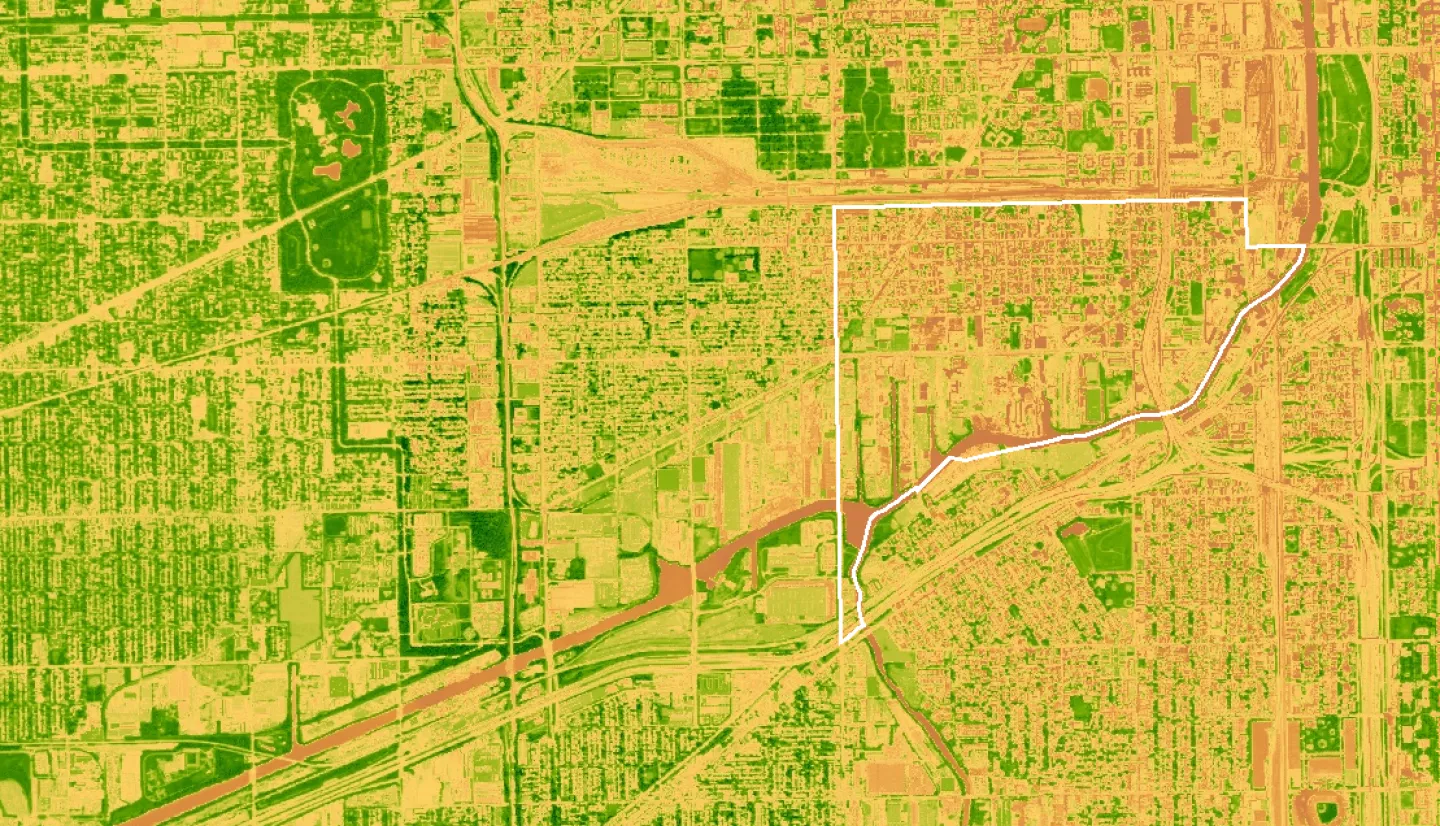
Objective 2: Data Integration and Visualization. Once the new variables were added, the team conducted workshops with community organization leaders on how best to present and visualize the data. Users can explore the map, variable panel, and filter by histogram distributions that represent census tracts visible in the map view. In addition to a map viewer, ChiVes also includes a community report page which aggregates information about a community, defined by the neighborhood name, zip code, or census tract number. The community report page allows users to quickly access key insights to help contextualize environmental and demographic factors, ideal for finding needed statistics for a report or policy brief. The purpose is to democratize this data for communities that have not historically had access to it.
Objective 3: Interactive Index Creation. The third objective will be to collaborate with our community partners on adding functionality that would allow them to combine and weight layers to create an interactive index. The interactive index will allow users to combine multiple layers to create an index that reflects their values and priorities for green space planning.
Objective 4: Tool Training for Ongoing Use. The final objective will be releasing the tool to the broader community and training them on its use. To support ongoing use, the research team will train community residents in how to manage, change, and update their community data. The codebase is completely free and open source with free/low-cost long-term infrastructure allowing other communities to adapt this project for their own needs.