This project connects Earth observation experts with epidemiologists and physicians associated with the Malnutrition and Enteric Disease Study (MAL-ED) study of childhood enteric infectious diseases. This objective is to develop a database of relevant climate, hydrology, ecology, and human activity at global gastrointestinal disease study sites of the MAL-ED study and of other enteric infectious disease studies from around the world. This database will be used to develop statistical models of high impact gastrointestinal infectious diseases, with the goal of informing understanding, monitoring, and prediction of gastrointestinal disease burden estimates and distribution of health resources in South America, Africa, and Asia (December 2020 Update). Note: In July 2020, this project was awarded supplementary funding through the NASA Rapid Response and Novel Research in Earth Science of Research Opportunities in Space and Earth Sciences 2020 to address the environmental, economic, and/or societal impacts of the COVID-19 pandemic. Using the integrated database of the original project, the project has incorporated COVID-19 information from the Johns Hopkins Coronavirus Resource Center to investigate potential environmental factors that may influence COVID-19 transmission.
Key highlights:
- The team has completed multi-pathogen modeling analyses, implemented an optimized Bayesian predictive modeling approach, and completed the application to shigella infection.
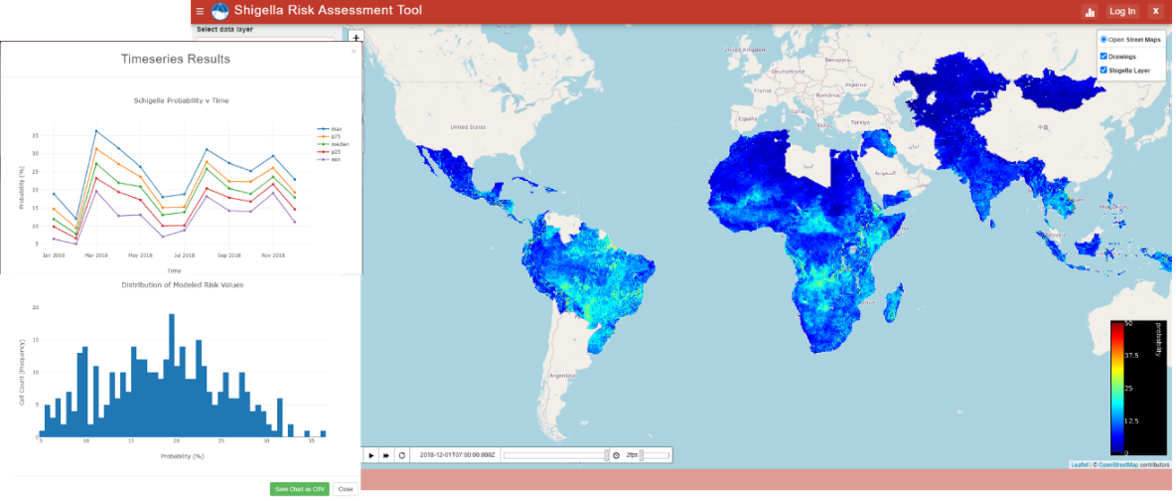
- The online visualization tool for shigella infection (Shigella Risk Assessment Tool) has been finalized (Figure 1).
- For the supplementary funding, the team has refined the COVID-19 risk analyses for Brazil, United States, and selected South and Central American countries for subsequent public dissemination.
- Selected publications:
- Colston JM, Faruque ASG, Hossain MJ, et al. https://pubmed.ncbi.nlm.nih.gov/33147841/ https://pubmed.ncbi.nlm.nih.gov/33147841/ . Int J Environ Res Public Health. 2020;17(21):8078.
- Colston JM, Zaitchik B, Kang G, et al. Use of earth observation-derived hydrometeorological variables to model and predict rotavirus infection (MAL-ED): a multisite cohort study. Lancet Planet Health. 2019;3(6):e248-e258.
Geographic scope: Africa (South Africa, Tanzania), Asia (Bangladesh, India, Nepal, Pakistan), South America (Brazil, Peru)
Earth observation data: Satellite-derived precipitation estimates; MERRA-2 reanalysis; Land Data Assimilation Systems; NDVI; satellite-derived SST; satellite-derived flood estimates; commercial optical remote sensing imagery
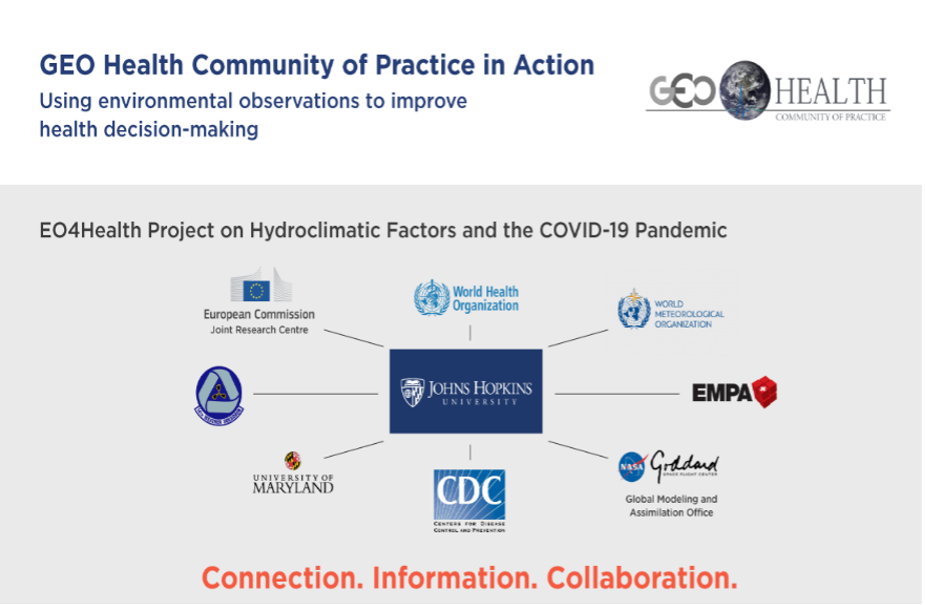
Users: Enteric infectious disease researchers and intervention experts; World Meteorological Organization (WMO); World Health Organization (WHO); Centers for Disease Control and Prevention (CDC); European Commission Joint Research Centre; NASA Goddard Space Flight Center; Swiss Federal Laboratories for Materials Science and Technology (Empa); University of Maryland; Johns Hopkins University (Figure 2)