The project is developing and running a global, automated, flood forecasting, detection, measurement, mapping, and flood risk updating integrated system. This is being accomplished by merging and sequentially linking relevant remote sensing and model information sources. The Dartmouth Flood Observatory (DFO) will provide a web portal/integration facility in which these automated systems and their data and services are assembled, and the final information products are published in an interoperable system based on Open Geospatial Consortium (OGC) standards.
Key Results Include
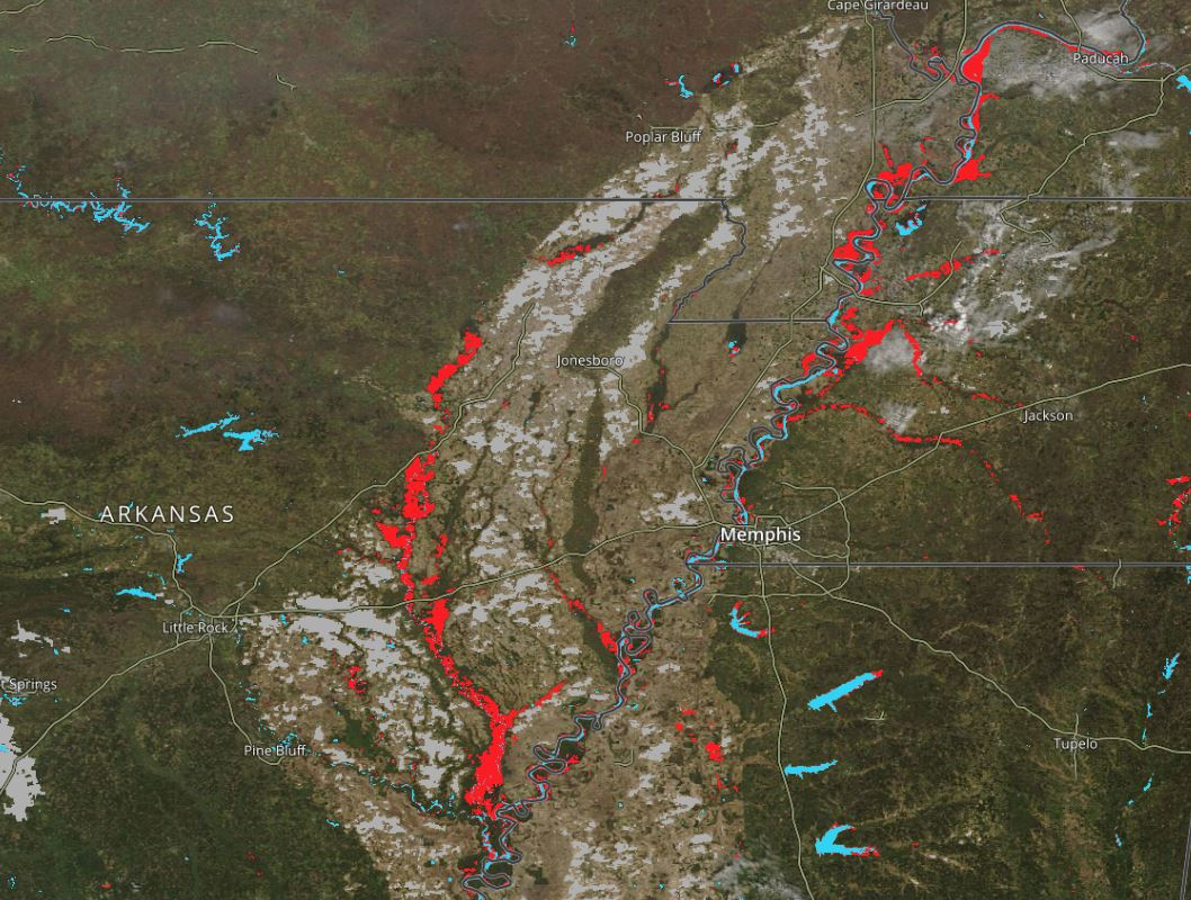
- The University of Maryland Global Flood Monitoring System (GFMS) results have been added to the DFO web map server together with the microwave radiometry-based River Watch information. Both are update automatically each day, and River Watch, although at relatively sparse spatial sampling, locally has provided validation of some GFMS flood alerts.
- The integrated system, “Flood Watch,” data products and services are already being provided to and incorporated within local end-user flood mapping/flood damage assessment systems used by a GEO Participating Organization (World Food Program) to determine “how severe" and "where" flooding will occur.
- MODIS-based Near Real Time Global Flood Mapping system has been integrated into the NASA LANCE system and within Flood Watch.
“We downloaded the information in GEOTIFF and went to the field to deliver humanitarian help by boat. The NASA map was very useful to identify the main "hotspots." - UNDP response team for Tropical Storm Cristobal in Mexico
Selected Peer Reviewed Publications
Huang, Z., Wu, H., Adler, R.F., Schumann, G., Gourley, J.J., Kettner, A., and Nanding, N., 2021. Multisourced Flood Inventories over the Contiguous United States for Actual and Natural Conditions. Bulletin of the American Meteorological Society, 102(6), E1133–E1149.
Kettner, A.J., Brakenridge, G.R., Schumann, G.J.-P., and Shen, X., 2021. DFO – Flood Observatory, In “Earth Observation for Flood Applications”, G.J.-P. Schumann ed., Elsevier, 147-164.
Tellman, B., Sullivan, J.A., Kuhn, C., Kettner, A.J., Doyle, C.S., Brakenridge, G.R., Erickson,T.A., and Slayback, D.A., 2021. Satellite imaging reveals increased proportion of population exposed to floods. Nature,596, 80-86.